Wednesday 27 August 2014

How high can we fly? and the psychological development of markets

Little has happened to my portfolio since the last post. That is to say ups have been balanced by downs. The main change has been a pause for breath by the dragons of my UK portfolio and nice run up by my China/US shares. They are now up by almost 3.5% in just under a month. (If that went on for a year it would be 42%). Big if, but still a nice reflection on my share picking given that the US market has seen much less than 1% move in the same period and there has been a 2.5% fall in the Chinese market.

Conclusion: steady hand on the tiller.


The evolution of bull and bear markets

Crowd Money draws a parallel between the emotions of the market and those proposed by psychologist to describe bereavement.
  • as the market moves from one wave to the next, first there is disbelief. The mood of the vast majority
    of the market crowd is that the last move, up or down, will not end. It is only the very brave that will take contrary positions and they are derided as delusioned mavericks. They find it hard to stand out and the positions they take are small reflecting the perceived level of risk.
  • acceptance  follows as people begin to make money and take ever larger positions. This is the period when buy and hold strategies yield good returns.
  • growing profit balances, encourage the view that the trend will never end and euphoria takes over. Price appreciation is seen as a certainty and large positions, including those financed by margin are taken on. The crowd rushes on oblivious to risk.
  • eventually demand, or supply is exhausted and the market begins to turn. Positions are liquidated as stops are hit and we move into a new period of disbelief.
  • renewed acceptance follows. It is important to note that the fear engendered by a falling market is a more powerful emotion than the greed that fuels a rising one. So prices fall faster in a bear market than they rise in a bull
  • following the sharp fall of the bear a period of depression follows when the crowd cannot believe that we shall ever see a recovery.

Sunday 17 August 2014

Unrequited love and the picking of shares

USA/China


At last my portfolio is making a little progress. This is happening on the UK side and the US. There are several factors which are helping.

First my assessment of the overall market worked out. I made a good guess that 16300 was a key level for the market in this latest viscous pull back. The Dow turned round at 16332 after a near 5% decline from its all time high. I bought on the way down, mostly on the 29th July but, as you know I picked Chinese shares. My guess that there would be a turnaround in the US market kept me in the bulk of my trades despite initial losses which, without a belief that this was not the beginning of the end, would have sent me scurrying for the hills. The net result is that I have 1.2% in profits in just 2.5 weeks. The scales up to 25% in a year - comfortably within the range that back testing predicts using Vector Vest.


That result includes nasty realized losses which I took on certain internet real estate shares. And it includes some shares which I have only just bought and which are still carrying unpleasant early losses. The big movers are BITA which is up 37% and XRS at 22%.

The realized losses would have been reversed had I held my nerve. I sold because of a negative article published in Seeking Alpha, a web site that publishes reports by all manner of commentators. I suspect that it includes rampers and short sellers as well as proper analysts. It's the second time I have been caught out by reading some of their stuff. I should be more careful.

UK

My performance in the UK has been equally good. I exclude GVC wich accounts for almost half of my UK holding. I picked it for different reasons from the rest of my UK portfolio and is doing very nicely thank you. 

I began my buying campaign on 1st July and a third of my new UK holdings date back to that time. On average my holdings are 3-4 weeks old. In that time they are up by over 5.5%. On an annual basis that
equates to over 80%. And this was in a period when the market fell by 1.5% overall but with major rises and falls in between.


Top performers are GEMD, up almost 20%, RNWH up 17% since 22 July, OMI up 14% since 30 July.

They were purchased using my old time tried and tested share picking system which, unfortunately cannot be back tested by Vector Vest. VV does not allow testing price movements relative to the market, nor does it allow the testing of cash-flow per share compared with earnings per share and its measures of PE and eps growth are obscure so I cannot check if they are comparable. These measures are all integral to my UK share picking technique.

Share picking


What is important is that this share picking system has kept me solvent and happy for 17 years. I have enjoyed a very comfortable lifestyle all of that time based exclusively on my share trading which has this share picking methodology at its core.

My approach to share picking is, and always has been, shot gun rather than sniping. I use a system for picking shares that I know works on average and buy at least five shares at a time which have the characteristics that predict, on average, that they will rise in the next few weeks or months. The proviso is that there is no general pull back.

My miserable performance over the past few years has been the result of my continuing but mistaken fear that the market would pull back. When I have had the courage to be active in the market, for example in 2012 I have performed up to or close to my average performance of 14% pa 1998 to 2013 (17% pa up to 2010).

Why we grow to love our shares

Treacy, in Crowd Money, talks of the problems from which investors suffer. He quotes a seminar delegate who said he found it much harder to sell shares than to buy them. Treacy's analysis is that rather than thinking of greed and fear as driving investment decisions, impulses which best fit the economist's view of market activity, we should use love as the best emotional analogy. 

When we fall in love we are overwhelmed by elation. We have made a choice of companion and we look
forward to a happy, exciting and rewarding relationship. This is paralleled when we buy a share. The good feeling beds in as profits role in. The thrill of the buy is in contrast to the dismay when things begin to go wrong. These are the emotions of a jilted lover. Loyalty goes unrewarded and a feeling of shocked ambivalence takes over. Disbelief makes the investor hold on too long. Too much has been invested in the relationship and it proves hard to give up. Blame is placed on the instrument, the adviser who recommended the share anything but a willingness to accept that things have changed. It is hard to throw in the towel and losses generate resentment.  Love makes us want to hold on. We made our choice at the outset and we cannot let go of the partner of our dreams. 


Sunday 10 August 2014

Crowd behaviour and its impact on our thinking

Friday's price action shows that the balance between supply and demand remains very much in balance. Since the last high of the DOW there was a week of near stability before a big sell off began on the 25 July. We are now eleven days (two weeks approx.) into that sell off. 31st July was the day of the big move when there was a 300+ point slide.  The four days around the big fall added up to a 600+ point fall. The low was hit on Thursday last week at 16334, 800 points below the high. The fall over the period on the S&P was comparable though the pattern looks different. 


We can no longer rely on coordinated movements in the major markets but on this occasion the Nasdaq mirrored the other US markets and the FTSE fell by a comparable amount. The Nikkei seems to have taken its cue from the US market to began its fall on the 31st July but has only puled back by just over 3%. The DAX, on the other hand, began its slide earlier at the beginning of July and fell by over 12.5%. 


The China market, in contrast, kept going till the 5th August after a spectacular near 13% rise from the 18th July. From then it slipped 4% to its low before recovering on Friday, in anticipation of the US markets. The chart below shows that it is in a very different place. It is a long, long way from its all time high which was way back in 2007. The market is trading 70% below the level achieved in those heady days. Even returning to the nearest local high of February 2013 prices have to rise by 30%.


Friday saw a recovery in the US markets. Too early to say that we are back in positive territory - the futures markets following the close were indicating a pull back. So we just have to wait and hope, if we are in the market.

My UK portfolio took a big hit on the 1st August but that was mostly down to GVC, which dominates that portfolio. There has been a pullback o my other shares too but they are still holding their own: 5 winners 4 losers, with 1st July being the beginning of the buying campaign. 

My China shares are also looking OK.

Crowd behaviour and its impact on our thinking

Treacy analyses the impact of crowd behaviour on our thinking in some detail. The key point is that as a market trajectory intensifies: i.e. the herd's move develops into a gallop there is a strong temptation to dispense with rational thought and to get swept along by the mood of those around us. 

Notions like "earnings don't matter" gain currency so that stocks with dismal fundamentals become part of
the cohort of strong "buys." Market commentators have to shout louder to be heard. Only the most outrageous forecasts, in the direction of the trend, attract attention so that we are subject to more and more extreme predictions about how far this bull market will run. 

Conversely equally shocking forecasts of Armageddon and the disintegration of the financial world as we know it become the norm as a market succumbs to the impact of a credit crisis or any other story that can begin a downward price spiral. And it captures the mind of fearful investors.

Bottom line we, as investors, are sucked into a prevailing fashion and no rational consideration can sway our thinking as we are swept along by the rush of the herd. Only the smartest, and the richest are fully able to take the risk of anticipating the bottom of the market.  Only they can afford  to take advantage of the bargains that are available as an irrational market slashed the prices of good and bad stacks alike. It is easier to take profits and stand to one side as the herd runs towards the cliff in the bull market. But even this has its dangers. Fund managers who pulled out of the dot com bubble early were pilloried for missing the last days of profit opportunity.

Wednesday 6 August 2014

Chart reading, rhythms, crowd behaviour and the shape of charts. Where are we now?

I am sitting and worrying. My Chinese shares are doing OK with the exception of three, all in the same sector - internet real estate marketing (SFUN, EJ and LEJU). These are going to be ditched at the open of today's market.

Since the others are holding up in the face of a strong head wind I am going to keep them pro tem. (BIDU, BITA, NTES, NOAH, FENG, YY, VNET, VIPS, XRS, WBAI).

To hedge my position I am holding a small chunk of VXX which moves in the opposite direction from the market. A bit like a contra ETF but this one is based on the VIX which measures the "fear factor" in the S&P. I have an order to buy more at the open of the US market. So there's my strategy for the US market.

In the UK I have bought and am holding a batch of shares picked by my oldest and best share picking system. I started buying on 1st July and overall they are up 2%, pretty good in a market that is down 3% in the same period. (EXI, WIN, BRIT, CAML, GEMD, RNWH, OMI, PUR)

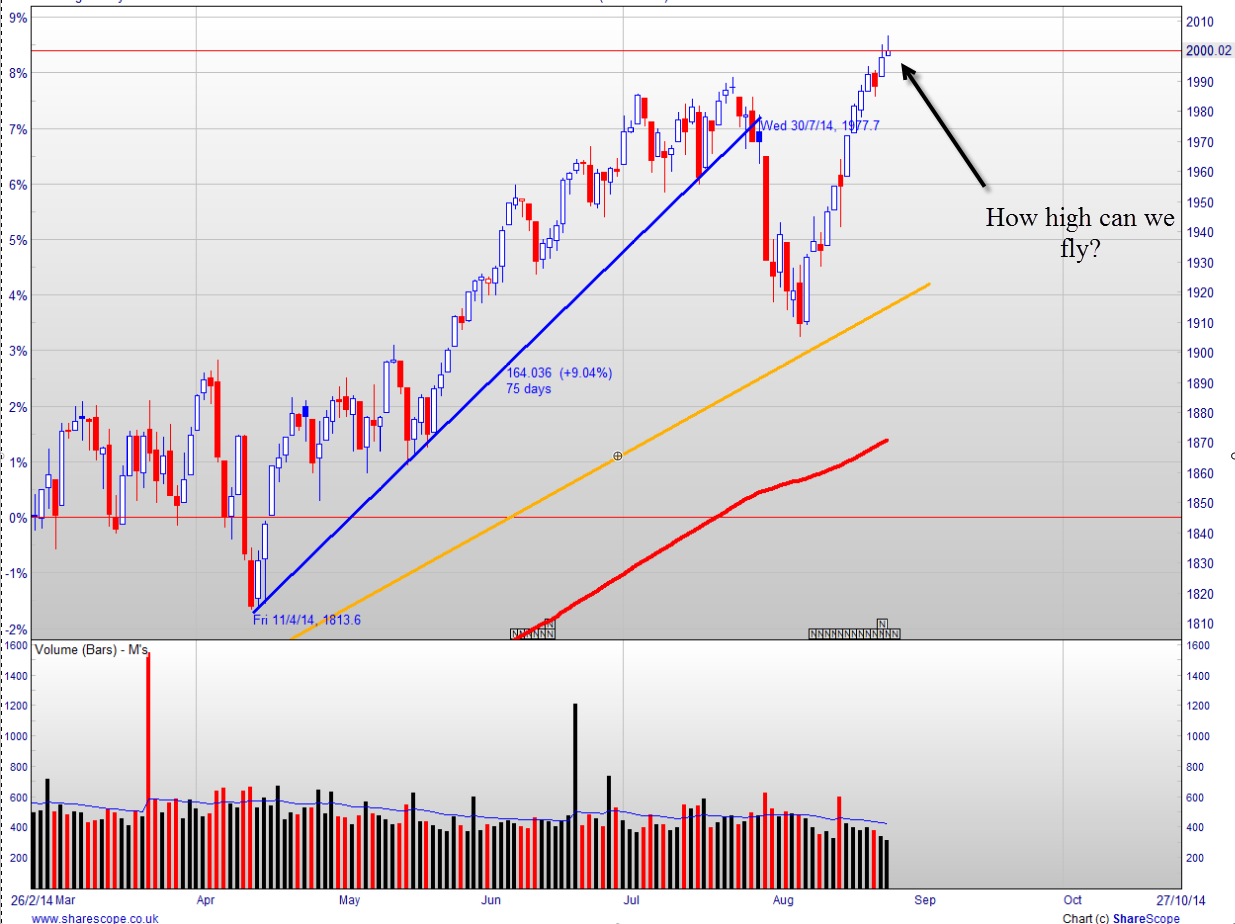
So the big question is where are we?

Chart reading 


Eoin Treacy quotes Dietrich Bonhoffer at the beginning of Crowd Money:

"If you board the wrong train, its no use running along the corridor in the other direction"

So which way is this train going?

Crowd Money puts forward the case for "Chart Reading" as a discipline quite separate from "Technical
Analysis." The difference, Treacy says, is that chart reading is the examination of charts to try to determine what they imply about "the actions, objectives and motivations of market participants." Chart movements show us the balance between supply and demand which in turn tells us whether buyers or sellers are in the ascendant.

Technical analysis, he defines as a technique which looks at the relation price to itself. It attempts to identify patterns and the opportunities that those patterns identify.

What Treacy is trying to identify are the rhythms of the market. There are two clear rhythms. These are trends when either demand or supply are in the ascendant. In these cases the market trends up or down depending in whether there is a preponderance of buyers or sellers. When there is a balance between buyers and sellers the market ranges until a new trend emerges.

The rhythms of crowd behaviour and the shape of charts


Four factors drive these rhythms for they create demand or supply. They are;


  • the story: a shift in the fundamentals of a market is identified and broadcast to participants: a new technology, a shortage of supply due to inadequate investment, a surplus caused by a reduction in demand by a major buyer. The propagation of information of this sort can fuel a bull or bear market as participants are convinced of the veracity of the story and the belief that it will influence the price of an asset which they own or wish to buy
  • liquidity: the easy and cheap availability of cash for buyers to participate in a market that is running is an important factor that fuels a bull market. The sudden withdrawal of that pool of money, or a hike in interest rates will rapidly put a brake on the move and throw it into reverse
  • governance: a good legal framework. One that encourages participation in a market and allows good investment decisions to be made easily so productivity is enhanced, can make the difference between a market that grows and one which stagnates
  • price action gives credence, or otherwise to our beliefs about what is happening in the market. If the price moves relentlessly in the opposite direction to the one predicted by our theory about the market, then we can be sure our theory is wrong. Price is the ultimate reality check.
With these four determinants in mind we can watch the market as we watch a herd of animals running across an African Savannah. The herd runs smoothly in one direction until the motivation for that move is exhausted and the group, all of its individuals moving independently swings and adopts a different direction.

The story has changed, or liquidity has dried up, or the regulation regime has been modified. But most of all we see the shift in direction.

Because the crowd is made up of individuals they do not always move as one and that is what makes reading the market difficult. A part of the herd may break away and attempt to pull in a different direction. Is that the beginning of a shift? Or will they be dragged back into the heart of the herd?

That is exactly where we are now. A breakaway is happening. The story of the market has not changed. If anything it is more favourable with economic conditions improving in some places. But there is a serious threat to liquidity. QE is coming to an end. Nevertheless we are not there yet. Interest rate rises are threatened but guidance suggests that the moment will be later rather than sooner.

So what we are seeing is a significant element in the herd of market participants taking fright. Will the herd turn to follow them and stampede in their direction? Or will the nervous ones be overwhelmed by the larger part of the herd? Will th majority see that plenty of money still flows into the hands of potential buyers? And will those buyers take advantage of the lower prices that the breakaway elements have generated?

We watch the price and we shall see.