Thursday 31 July 2014

Is this the big one? and Roundaphobia

Last few days I have been biting my nails. I'm almost up to my wrists.It wouldn't be so bad if I had not been tempted in - yet again. I know, I know. I keep saying it and I still I go for it.

This time it has not been so bad and I'll tell you why.

Lets start with some market graphs.Here's the DOW. This is the nasty one. The S&P is no better but the NASDAQ does not look nearly so ugly. (Don't worry about the blue/green line I am playing with the 60 day moving average.) Focus on the fact that three days ago the market broke a support line that has been there since January. Bad enough in itself and even worse when you see that the next level of support is around 16300 almost 450 points below where we are now and 850 points from the high.


There are various explanations - fear of the end of QE and higher interest rates stand out. A big surge in US$ value underlines this view. Flight to safety and all that.

Roundaphobia


Then there's the possibility that the market struggled when it hit 17000 - a big round number often creates a
market barrier for psychological reasons. This is another theme from Crowd Money. Treacy calls it Roundophobia. 12000 and 14000 were major barriers for the DOW on the way up. 12000 precipitated a 36% fall and once it hit 14000 the market tumbled over 50%. Spooky!

FTSE


The FTSE is struggling too. But it has not been pushing ahead as strongly as the DOW so today's movement is well within the bounds of a normal retracement.


China 


What I did was look at this graph and wondered whether I was onto a good thing because of the spectacular breakout.


The shares I bought were Chinese ones with strong fundamentals, quoted on the US market. They have been hurt, I was a late to the party, but they are still doing better than US shares. Question is will they be dragged down by a general pull back or is China on a different trajectory. It does not seem to have been linked to the US for some time. Let's hope that the decoupling still holds.

More nail biting in the next few days. I have bought VXX as a hedge. Time will tell and I can always run for cover.


Monday 28 July 2014

How trends end - part 3

There is little to say about type 3 endings as describe in Eoin Treacy's Crowd Money. They are a compound of the other two types.

In the example below, copper at the end of 2012, the ending begins with the sort of acceleration associated with type 1 but when the market pulls back, instead of falling all the way it finds support. There must be a level where it runs into latent demand. Demand begets demand for the strong upward reaction brings back
traders who were stopped out and now are reluctant to miss the upward action. The market then begins to range between the previous highs where it meets a vacuum of demand and previous lows where buyers are waiting to jump aboard again. The long players find it hard if not impossible to make money because the market does not pull up strongly enough after they find entry points. Short traders, on the other hand, are finding it easier to profit on the downside. Eventually is is all over as the market fails to make an upside break and with no new buyers and holders selling out before they have lost too much the bears win the battle
.

Not all endings play out the same way but with the tree types to look out for it should be a bit like an elephant: hard to describe but also hard to miss. We are basically looking for three markers

  • sudden acceleration
  • loss of momentum
  • abnormally large pull backs
I'm watching out for these.

Saturday 26 July 2014

How trends end - part 2 and shifting tectonic plates

Type 2 End of Trend


Treacy, in Crowd Money, points out that although the trend which ends in acceleration is relatively easy to spot, the unfortunate truth is that it is a rare event. Other reversals do not display the same regularity and finding them requires more head scratching.

The way this type of reversal plays out is based on where stops are set by participants. The process is a little
counter-intuitive. The market has been happily trending upward with a series of higher highs. Now we begin to see upward movements becoming less successful and the market spends more time ranging (i.e.flat). Most of the money in the market still feels safe because the movement is still upward albeit at a slower pace.

Momentum has subsided. The losers are those who try to make extra money on the upside by buying when the market breaks upward. In earlier times when momentum was strong they could rely on the upmove to bring them short term profits. Now they are regularly knocked out of the market with a loss. On the other hand short traders who sell these rallies are starting to make money.

It becomes clear that there is declining demand above the market. Participant will start to lose interest and start to look for alternative markets that offer better prospects. Long term traders will have their stops at a recent low so they can pull out when the trend is proved to be ending. But above them shorter term traders and those who are leveraged will have their stops higher up. With each upmove followed by a reaction a growing number of stops will be sitting at each reaction low and will be hit as the market moves down.

Once the market hits the point where there is no more demand - the last upside buyers have lost their nerve -  the market drops abruptly taking out all the stops of short term traders and eventually the stops placed at the previous big reaction low by long term holders. There is no longer any support for the market and it crumbles with no immediate cause. It is a bolt from the blue.


A changing world


I would like to quote, verbatim an analysis that I found extremely revealing. It summarizes perfectly something I have been thinking but have felt unable to put into words. Treacy does it beautifully:

Where once it was assumed that the risk in emerging markets was clearly more acute than so-called developed markets, the delineation is no longer so cut and dry. Since the year 2000 alone , China has emerged as the second-largest economy in the world. Brazil has evolved from hopeless debtor to a creditor and host of both the soccer World Cup in 2014 and Olympics in 2016. The Philippines has become a creditor to the IMF rather than a perpetual supplicant. At the same time European countries, long lauded for the integrity of their institutions and stability of their democracies, have had to go cap-in-hand to the IMF for enormous bailouts. The USA, which has long been vaunted as a bastion of free enterprise , capitalism and the rule of law has gone through two massive busts in a decade and is the largest debtor nation on earth. When characterised thus, we need to ask ourselves if there is a disconnection between our perception of risk and where the risk actually lies.

Treacy, Eoin (2013-10-07). Crowd Money: A Practical Guide to Macro Behavioural Technical Analysis (Kindle Locations 3379-3386). Harriman House. Kindle Edition. 


How trends end - part 1

The ends of trends


I'm going to start with a bit more review of Crowd Money. It grieves me to say it but it is a tedious read. Too much repetition and a rather dense style. A great pity for once you have managed to plough through you have learnt so much excellent stuff.

I'm going to pick out bits and pieces in the order that I find most useful. The thesis is that the stock market is driven by human psychology and the way the psychology of market participants is driven by events. Very specifically we're talking about supply and demand. Share owners' actions a motivated by their expectations of what will happen to the prices of shares that they own and by their innate beliefs.

There is strong evidence that the most powerful driver of belief about the future is that it will be a continuation of the past. The crowds of share owners will only be forced out of their inertia when the facts force them to change. Hence Treacy's very compelling analysis of trend ending.  He identifies three types. I'll only deal with type one in this post. More soon!

Type 1 Is characterized by a sharp acceleration of price movement which is a sign that a crash is imminent.

Take a look at silver in 2010 -2011. The changes in demand and supply that this chart reveals work like this. At the end of the ranging period some new story about the prospects for silver drove up demand. The previous supply demand equilibrium was broken and prices began to rise until a point was reached when the consensus view decided that prices were high enough. More of those holding silver were encouraged to offer their holdings and/or fewer new buyers were tempted in.

The positive story persisted and demand began to outweigh supply once more. This time even more buyers were encouraged to buy because they were kicking themselves for missing the first part of the rally. They now held the belief that the market would rise because that is what it had done before. As the expectation of rising prices was reinforced by actual rising prices more and more buyers were sucked in by fear that they were missing a fabulous one way road to riches.

At this stage many participants were buying on margin - buying shares with borrowed money. Eventually there were no new potential buyers left and the price was so high that increasing numbers of holders were tempted to take profits and a dramatic reversal took place. Buyers on margin were forced out of their positions because their equity in their holdings had been wiped out, catalyzing the crash. Other late buyers saw their profits disappear and joined in the rush for the exit and supply was ramped up some more.  

A sign that often confirms a type 1 top is taking place is a key day reversal. This is a candlestick pattern in
which the daily price movement as shown by a candle, engulfs the previous candle. This means that the price starts the day up, suggesting that the upward price trend will continue. But as the day wears on supply overwhelms demand and the price ends below the previous day's open. See the chart of the DAX for an example.

In most cases a reversal of a downtrend exhibits very similar characteristics to the ones just described though the moves are in the opposite direction.

I'll post description of the other two main reversal patterns shortly.

The Dow


In the mean time the uptrend in the US market moves on with what looks like a normal pull back today. There is some narrowing of the lines that link the top and the bottom of the trend but it is too early to say if this has any significance.


Friday 18 July 2014

Why don't I listen to myself?

You may remember that a while back, it must have been in May because it was all about 'sell in May,' I told myself to sit on the sidelines. Did I heed my own advice. Of course not. I'm not talking about special situations like GVC, I'm talking about full scale return to the market.

I've only myself to blame. There I was kicking myself for having lost out on the relentless rise in the markets so I thought I'd give it a go. I should have known better and I've paid the price. Yesterday I pulled out of the US market - you will know what shares I bought because I wrote them all down. Anyway here I am feeling a lot like the Brazilian football team in the World Cup. At least I pulled out before any serious losses were incurred. But there were losses none the less. And I do have a couple of minor victories to report.


My foray into the gold market ended well. Not only was my timing close to being right on entry. I missed the big first day, but I was there for the second. I picked good shares and they almost all raced away. I also jumped off the train as it turned and I banked 2.4% in three weeks.

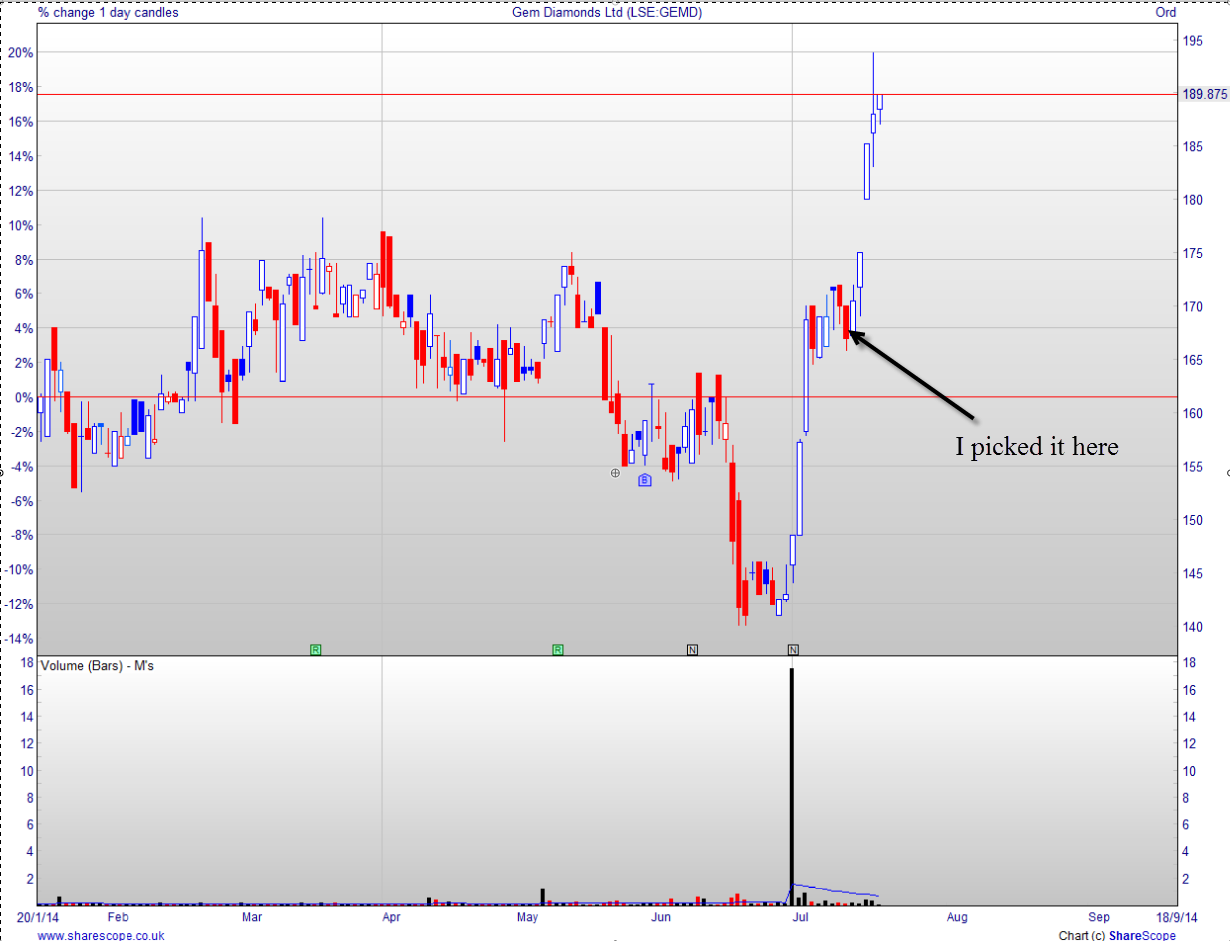
I also made some nice picks in the UK market using a tried and tested old method for selecting shares and made 5.5% in EXI since 1st July and 10.5% in GEMD in a week. I've proved to myself that I can still do it and that I am not wasting my time even though I am having so much trouble at the moment.


And then there's GVC which trundles on increasing revenue (helped by the World Cup) and raising its already mouthwatering dividends. I do worry that there may be some bad news at some point. No evidence whatsoever, just the anxiety that such a good story can't go on forever.

Crowd Money

And that brings me to my latest reading. Crowd Money by Eoin Treacy


Several years ago I spent a small fortune going to a one day presentation called the Fuller Money Chart Seminar (now known as the Fuller Treacy Chart Seminar). I also subscribed for a while to these guys' daily service. The seminar taught me a lot and the service was good but far too wordy for my taste. 

I can't read through the volumes of, admittedly, terrific stuff that is churned out day after day. They must spend hours scouring the torrent of material produced by the investment community, but they also select and republish material that their subscribers glean from the world of economic and market texts. The analysis they choose to publish comes form all over and since they also comment on the items it is a fabulous resource. If you have the time to work through it. Even though it is not for me (my brain is too small to absorb so much) I cannot recommend it too highly.
On top of that there is the most comprehensive chart library that I have ever seen. It is access to that library that I miss the most. You can try out the service for yourselves for just £55 for a month - and I do recommend it even if you do not subscribe regularly. You will not be disappointed.

So back to the seminar and the book. The seminar has been running for 44 years and has been enjoyed by serious stock market types, mostly professionals, across the world. When I went I think only about one quarter of delegates were paying their own way, the rest were sent by the institutions who employed them. And now Eoin has distilled the important features of that seminar in a book. DO NOT MISS IT. For just short of £30 you have the benefit of two lifetimes' investment experience.

I knew it but did not remember clearly enough

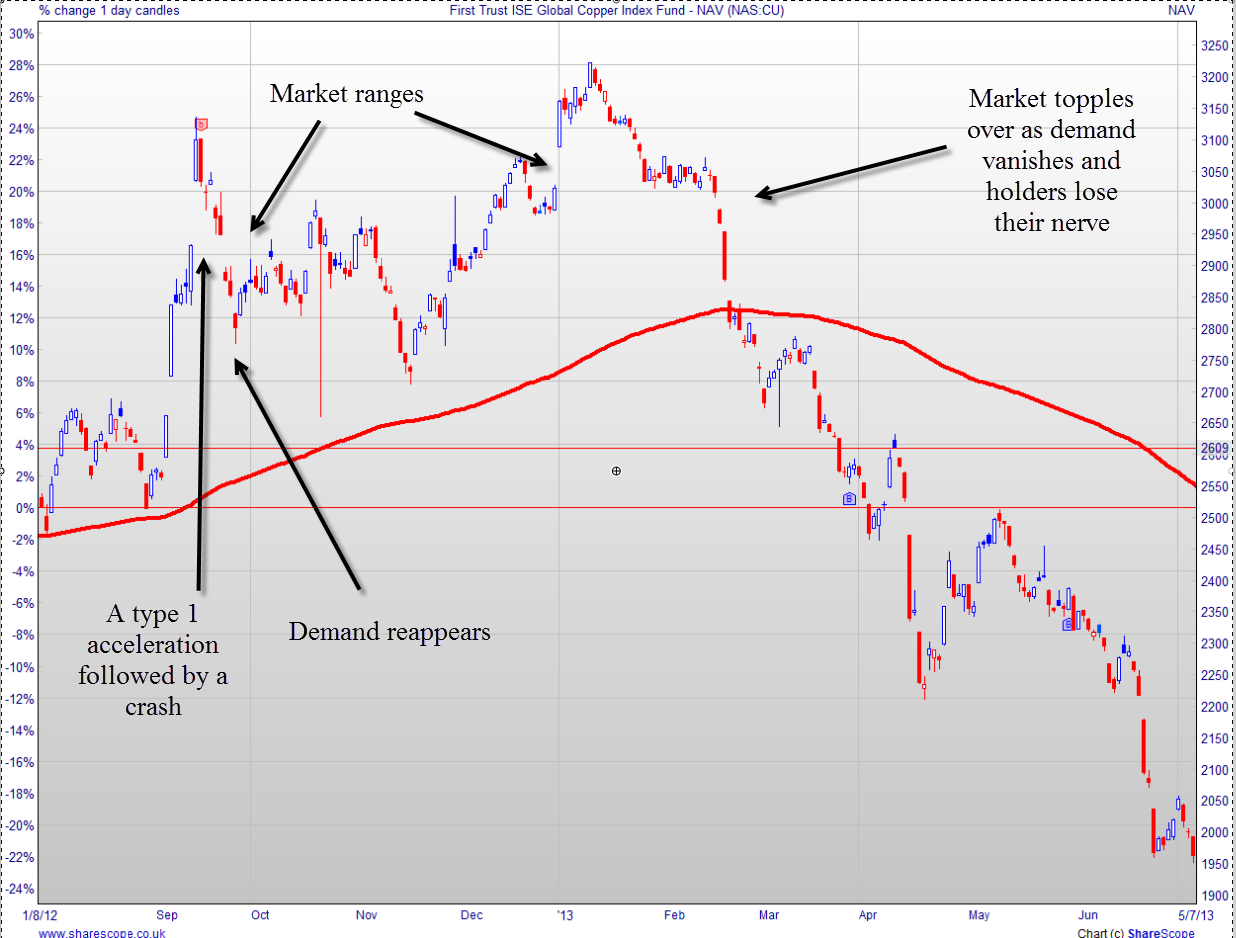
The chart seminar, and now the book, is all about the psychology of the crowd that is the market. Charts betray what is happening in the collective mind of that mob. The trick that I missed in this current stock market rally was that I listened to the Gurus who crawl out of the woodwork at every market bottom and preach a mantra of never ending gloom and markets that will fall to zero. My big folly was that I could not get their words out of my head and went on believing their rhetoric. I missed almost the whole of a five year bull market. (I've made a measly 5% per year over the period).

I'll give you more of a review of the book in the next few posts but here is a taster of what I should have known all along. 

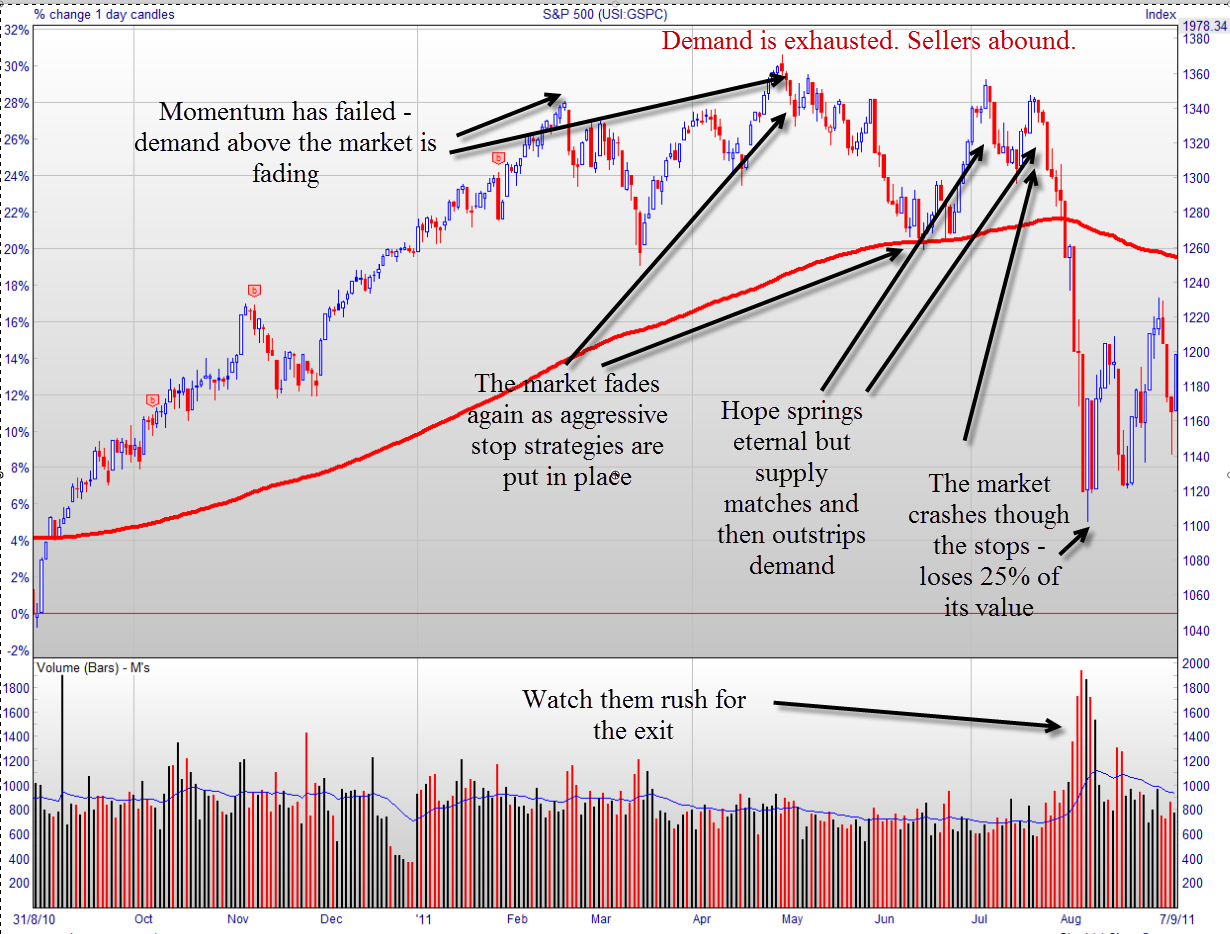
Crowds get swept along by a madness that keeps them thinking that the market will go on in one direction forever. They listen to pundits who whip up the fever by predicting ever more action in the prevailing direction. 

For example, the dot com bubble provided a paradigm that would never end. Companies did not have to generate earnings because they were in an industry that would sweep the world to a new and better place. Naysayers were ridiculed and the bull market went on and on until the point was reached where there were no more buyers. Everyone was in and leveraged to the hilt and now there was no more money. At that point there were only sellers and the market began to tumble. Even then the pundits did not give up. The stockbroker Killik was notorious, telling their clients that every pull back was a buying opportunity and encouraging them to throw good money after bad.

By now, cautious commentators who had been ridiculed as eccentrics, came into their own and the market was talked down until the bottom was reached. But some continued to talk down the market  at the bottom, just like Killik at the top, warning of the Armageddon that was to come. The only way to survive was to take what money you had left, turn it into gold coins and go as far away from civilization as you could. There you would hole up and watch the smoke rising in the far distance. 

I bought a book by just such a pair of pundits in 2009. It is called Wake Up! by Jim Mellon and Al Chalabi.
It was not entirely their fault. Their message played into my generally pessimistic, or at least overcautious, mentality. So I was receiving their message loud and clear and was not critical enough.

Bottom line is that Eoin Tracy's book has reminded me that I was foolish to hold on to the message of doom for so long and I plan to have a ceremonial burning of Wake Up! later today. 

In the mean time I am starting to look at charts in a quite different way and hope I can make a little money before this bull market is over.

More on Crowd Money to come.


Sunday 13 July 2014

Bleak week

I haven't posted for several days. As you know I went back into the market thinking my fear had been keeping me out for too long. What opportunities I had missed!

Did I pick my moment! Withing days I was deeply regretting my move and I am still nursing my wounds. But this time I have held my nerve a bit better.

First things first. I bought more shares based on a selection system which has a good record - shares that have shot up in price on high volume. I bought: VRS EVRY DRL CBAK

The first pull back came two days later. I lost the money made on my first day out - no big deal. Then another bad day and I lost a bundle.Another bad day and another big loss. By now my nerves were giving out and I ditched the worst performers.

I do run risky share picking systems and I win or lose in big numbers very quickly. In the present case I'm talking of losses of 10-12% in a couple of days.


A market recovery brought me back small beer and I lightened my load a bit further. Then the big crash as the Espirito Santo Bank in Portugal threw a wobbly into the market and there was a huge fall.

Panic stations? I looked at the chart and could see that support had  been broken, but only just. As the day moved on the markets regained their calm and the recovered to well within the support line. I held my nerve.

The next day my portfolio staged a strong recovery on a weak market move. The other thing was that only two of the stocks I ditched continued to fall. By selling the rest I sacrificed a big chunk of recovery money. I've always hated stop losses and this is why. There is almost always a bottom in that market somewhere, and it's always darkest before the dawn. As long as the market has strength and you pick your shares using good selection criteria it's best to hang in.

It wasn't all bad

There were two bright spots in all of this. My UK shares held up well with GVC returning to an uptrend. This was despite the fact that the FTSE lost almost 4%.


 And my gold shares have proved to be a smart move. They have made 6.7% since the 20th June. They behaved strangely during the pull back but ended very strongly up.


Bottom Line

The support line has held. The US economy is still strengthening and although the QE will come to an end the US government is still pumping huge amounts of cash into the banking system so for now the rise looks set to continue.


Wednesday 2 July 2014

I throw in the towel

It is with the greatest trepidation that I report that I am back in the market. It's not that I have overcome fear, I am terrified, it's that I can no longer ignore what my eyes are telling me.

The dow has broken a six day downtrend to make yet another new high. (I ignore the little voice that says triple top.)


The S&P ploughs on upwards. It is now 30% above its last high and almost 90% above its low in March 2009. And I have benefitted from almost none of that activity.


The FTSE has not performed nearly so well. After a stellar start in 2009 and 2010, it has limped along. 


My performance over those years has been dismal. I have been wrong footed at every turn as the market performed well at a time when I thought disaster was about to strike.
  • I made decent money in 2009 but had my worst performance relative to the market ever.
  • I made money and comfortably outperformed the market in 2010
  • 2011 was a disaster
  • 2012 was another good year with good market outperformance
  • 2013 was another bad year (market up, me down)
In those 5 years I made a measly 24% return on capital (a bit less than 5% per year) while the market went up by 63% (Note for historic reasons I use the FTSE as my benchmark). Unfortunately I cannot live on that so I have been eating into capital. 

I turned the corner in November and I am comfortably outperforming the market with only 20% of my funds in the market. This means that the money that I have at risk has returned 39% - almost 60% on an annualised basis.

Enough of my moans, groans and self comforting revisionism. 

What I have done is bought a raft of UK shares looking for my old stalwarts - companies which are outperforming the market, have low PE and good growth prospects. To these I have added some that have exceptional dividend yields and other solid characteristics. My selection: ACHL EXI BRIT CAML - may the force be with me.

In the US I have added to my gold portfolio (which is performing well). I have chosen based on VectorVest search criteria that have been good performers recently. The selection is JOEZ ENZN FORM PQ AXAS HILL and PAM. I have also had another go at India (SCIF).

I now just hope and pray that my timing was not seriously off.