Thursday 30 January 2014

Close shave

UK

Let's start with the UK market because that' where I almost came a cropper. After that tweezer pattern, which should have driven me out of the market before any damage was done, we had three days of heavy falls (53 points, 110 points, and 113 points). I sold early on the second day. Then Tuesday was a modest up day and I did nothing. The bad day was yesterday. There was a 73 point rise (95 if you include Tuesday's rise) from the open. That sort of thing makes me worry if I'm out of the market and badly need profits. Then there was a most violent wobble as the US futures' indication switched from a positive open to a negative one. High to low on the UK market was 163 points before it closed 28 points down.

Luckily I was not tempted back into the market by the initial rise. Today the fall continues, though currently the support line seems to be holding  the fall back. If there is going to be a bounce it could be here.


US

The US market has come down by 4% from its peak when measured by the S&P and by about 4.5% when measured on the DJI. The DJI has broken through two support levels and is sitting on a third. As ever when I don't quite know what to think I put the Fibonacci retracements on the graph. It's a bit like rubbing your rabbit's foot for luck. The 38% level held the market for a couple of days and the 50% level is not far away.
You'll remember that Fibonacci was a medieval mathematician who brought an ancient eastern mathematical observation to the West. This is that  if you create a sequence of numbers starting with one and adding the new sum to the previous one (1+1=2 2+1=3 3+2=5 5+3=8 8+5=13 and so on 21, 34, 55, 89, 144...) The ratio between each new number and the previous one settles at 61.8 (89/144=61.8%). The ratio between numbers two apart settles at 38.2 (55/144=38.2%). 61.8 is the golden mean and the numbers in the sequence are frequently found in nature eg numbers of petals in flowers are normally members of the Fibonacci sequence. Traders superstitiously believe that after a share price has moved in one direction it will retrace (pull back) to one of the Fibonacci ratios of the previous move. Say the price has risen by 500 points and starts to retrace it will stop when it has fallen to a point 309 points from the start of the up move it will stop falling. 191= 38.2% of 500, 500-191=309. The belief in Fibonacci retracements has a tendency to be self fulfilling.

So the fun goes on. As the market moves I shall be tempted back and shall be glad I stayed away. The problem is exacerbated by the fact that my selection of shares, the ones that I sold, are not doing too badly and the ones in the US, all those China based ones slip in and out of being profitable after I sold out. A credit to my share picking, but no comfort when I assess my decision to strategically withdraw.

Futures are indicating a rise on the US market despite the second tranche of tapering which was announced yesterday. On the plus side for shares indications are that interests rates will not be raised any time soon.


I have to say that GVC is not doing well. Falling fast on low volumes.

Saturday 25 January 2014

He who fights and runs away

I'll get to fight another day.

I am a great believer in the idea that 'actions speak louder than words'. What do I think of what has happened in the market over the past couple of days, and what do I think will happen next? Whatever explanation I come up with and whatever forecast I make means nothing. It is theory: an "after the fact" justification of what is now known and what was unknown two days ago. What you may find more helpful is knowing what I have done. That encapsulates what I now believe. What have I done? I have sold almost all the shares that I owned. I was almost fully invested so that is a lot of shares sold and and a lot of money encashed.

First let me say that I have no idea if I have done the right thing. The market may bounce back. For some time I have been feeling very bullish. That bullishness vanished yesterday. I believe that the ability to change one's mind in the face of facts is a strength. I shall not be afraid to change my mind again if the facts change once more. The thing that has changed is the mood of the market.

I sold my shares at once when the UK market opened down and when I saw that the futures indicated another big fall was likely in the US. I sold my American shares when the US market opened and I took another big hit after the one I'd suffered on Thursday. With the benefit of hindsight I would have sold my UK shares one day before because of the tweezer pattern I mentioned in yesterday's blog.


I was out when the US market opened on Thursday and I might have thinned my holdings if I had been watching developments. On that day the market spent the afternoon and evening giving me back some of my losses and there was insufficient evidence to distinguish this fall from a temporary pull back.

Once the market opened yesterday the writing was on the wall and I pulled out without hesitation.


So what now? Despite the setback, I have still made a significant inroad into paying back my accumulated losses but my situation remains  poor. I hate to say it, but for me the best outcome would be a very sharp pull back. 20 or 30% would be ideal. I have the skills to pick shares that make the most of the recovery and the returns that can be made in those circumstances are exceptional.

But that is wishful thinking. What is more likely to happen is that I will watch the market swing back and forth, repeatedly tempting me to jump on board a rally which turns into a bull trap. This is a problem to be tackled another day. For the time being I am out and can breath easily. Early indications are that Monday will be another nasty day.

So good luck to one and all.

GVC


Incidentally I am still holding my GVC shares. The dividend yield is phenomenal and paid quarterly. The PE ratio and earnings growth are exceptional.  Nevertheless a big pull back in markets is bound to hurt the share price. If I did not already have a substantial holding I would see any significant price reduction as a buying opportunity. I don't want to sell because the spread makes sale and repurchase tricky and I could miss a good news filip.

Just so you know, the risk for this company is that they operate gambling related services in unregulated markets. New regulations could disrupt their operations.

Friday 24 January 2014

That hurt!

My high level of exposure to Chinese shares meant that yesterday's stock market pull back hit me particularly hard. The Chinese PMI (Purchasing Manager's Index) fell to below 50, the borderline between expansion and contraction of the economy. Underlying industries' problems is a cash shortage in Chinese banks, which the government is addressing by continuing to pump liquidity into the system. Sound familiar?

What appears to have spooked US markets is the worry that the contagion will infect US banks. In our world financial system banks lend each other money and a crisis in one economy quickly spills into others.

Having said all that the fall in the market does not look any worse than other bad days. Yesterday's fall was only slightly worse than last Monday's. More worrying for me was the volume spike that occurred last Friday just as the market squared up to the beginning of this week's horrible 262 point fall (so far).


The picture provided by the S&P is somewhat less frightening. The price movement is comfortably within the channel that has established itself since the high of December 31st. Price movement is also well short of the latest support line.


That's how it looks as of last night. We shall know more as the markets open today. I'm ready to run for the hills, or not, when we see whether the mood remains gloomy.

The pull back has affected the FTSE too. I was already worried when I saw the price action on Wednesday. For the second day running the market pulled back sharply from a new high creating what is known as a tweezer pattern in candlestick chart analysis. Not good news. See what happened after a single candle version, the shooting star.


Sunday 19 January 2014

Sell in May

Since I started trading I have had the impression that I lost money in the summer. It was a feeling and I have never made a proper analysis of the phenomenon till now. I guess it was because my overall performance has been good enough to carry some dead weight and still provide me with a decent living. A combination of a couple of poor years trading and higher than normal living expenses have eaten into my capital base. This has made me think hard about where my profits are generated. I can no longer be complacent about making the odd loss.

I have therefore prepared a seasonal analysis of how markets move in order to organise my trading better. The results are startling because of how powerfully the support the hypothesis that summer trading is for the birds.

I looked at the movement of the following indices:

  • UKX (FTSE 100)
  • NMX (FTSE 350)
  • ASX (FTSE All Shares)
  • DJI (Dow Jones Industrials)
  • GSPC (S&P 500)
I looked at the changes in three four month periods which can loosely be described as Spring Summer and Winter. 
  • 1st January to 30th April
  • !st May to 31st August
  • 1st September to 31st December
I carried out the analysis over the past 10 years. Here are the numbers:

1Jan to 30 Apr
UKX NMX ASX DJI GSPC
2013 9.0% 9.5% 9.6%   13.2% 12.0%
2012 3.0% 4.2% 4.4%   8.2% 11.2%
2011 2.9% 3.0% 3.0%   10.7% 8.4%
2010 2.6% 3.8% 4.1%   5.6% 6.4%
2009 -4.3% -2.0% -1.6%   -6.9% -3.4%
2008 -5.7% -5.6% -5.7%   -3.4% -5.6%
2007 3.7% 4.1% 4.2%   4.8% 4.5%
2006 7.2% 7.9% 8.0%   6.1% 5.0%
2005 -0.3% -0.6% -0.6%   -5.5% -4.5%
2004 0.3% 1.2% 1.4%   -1.8% -0.2%
AVERAGE 1.8% 2.6% 2.7%   3.1% 3.4%
           
1May to 31 AUG            
2013 -0.6% 0.1% 0.2%   0.7% 3.2%
2012 -1.7% -1.6% -1.6%   -1.4% 0.1%
2011 -11.1% -11.3% -11.2%   -9.3% -10.6%
2010 -5.9% -5.8% -5.8%   -9.0% -11.6%
2009 15.7% 15.8% 15.9%   15.6% 16.3%
2008 -7.4% -7.3% -7.4%   -11.3% -9.0%
2007 -1.8% -2.3% -2.4%   1.7% -0.8%
2006 -1.9% -2.1% -0.1%   0.3% -0.1%
2005 10.3% 11.0% 10.9%   2.8% 5.5%
2004 -0.7% -0.9% -1.0%   -0.9% -0.5%
AVERAGE -0.5% -0.4% -0.3%   -1.1% -0.8%
           
!Sept to 31 Dec            
2013 5.2% 5.8% 5.8%   11.9% 13.2%
2012 3.3% 3.9% 4.1%   0.1% 1.4%
2011 2.8% 1.9% 1.6%   6.3% 4.4%
2010 9.9% 10.6% 10.7%   12.7% 16.4%
2009 12.3% 11.6% 11.2%   12.0% 11.7%
2008 -20.9% -22.3% -22.6%   -24.0% -29.6%
2007 2.4% 1.2% 0.8%   -0.7% -0.4%
2006 4.6% 6.1% 6.3%   8.7% 8.2%
2005 5.4% 6.4% 6.4%   2.5% 2.2%
2004 6.9% 7.8% 8.0%   6.0% 9.6%
AVERAGE 3.2% 3.3% 3.2%   3.6% 3.7%

In all cases the indices registered average falls in the summer periods.in sharp contrast to the rises registered in the spring and winter months. In the spring period of the year the UK markets registered positive movements in 70% of the years while the US markets were positive 60% of the time.

In the Winter period the UK markets were positive 90% of the time while the US markets made a profit 80% of the time.

Performance in the Summer months was slightly more muddled with two years (2005 and 2009) being big exceptions to the norm. 2013 was also slightly better than normal. Overall we can say that that summer time offered poor investment climate 70% of the time.

Here is a chart that looks at monthly movements in the S&P since 1956. This also supports the thesis that summer trading  is unprofitable.

Conclusion: Sell in May. (But watch out for those exceptions). You have been warned.


Friday 17 January 2014

She didn't say yes, she didn't say no.

What is the market doing now? Good question. I prefer to look at the US market for although the tight link between international markets has weakened I still think that the US still has all the best tunes. That's where we should go to get our view of the markets' mood.

It seems to me what the markets are doing now is consolidating. They made substantial gains in the Santa Claus rally and they are now taking a pause for breath. "That's a very anthropological view of something as inhuman as a market," I hear you say. Well, ignoring the fact that markets are driven by human decisions, I agree. This is not a pause for breath it's an intense battle. Traders who have been in the market while the move up developed have now taken sides:

  • there are the naysayers who think to themselves "enough is enough" and they bank their profits
  • then there are the optimists who say "just look at what the market has done, there must be more to come". They take the pull-backs as opportunities to buy up shares dumped by the pessimists. (Don't forget: the trend is my friend)
The pattern formed by the actions of the warring sides is called a consolidation and it can go on for some time. It comes to an end when the nerve of one group or the other is broken, or when some piece of news settles the argument from the outside. Then the winning group pats itself on the back while the losers lick their wounds.


I have said before and I say again I am a bull, partly because of time of year and partly because the response to the beginning of tapering of QE was so muted.

As ever I am ready to switch direction on a sixpence if my view turns out to be mistaken, but for now I am basking in very satisfactory improvement in my position.

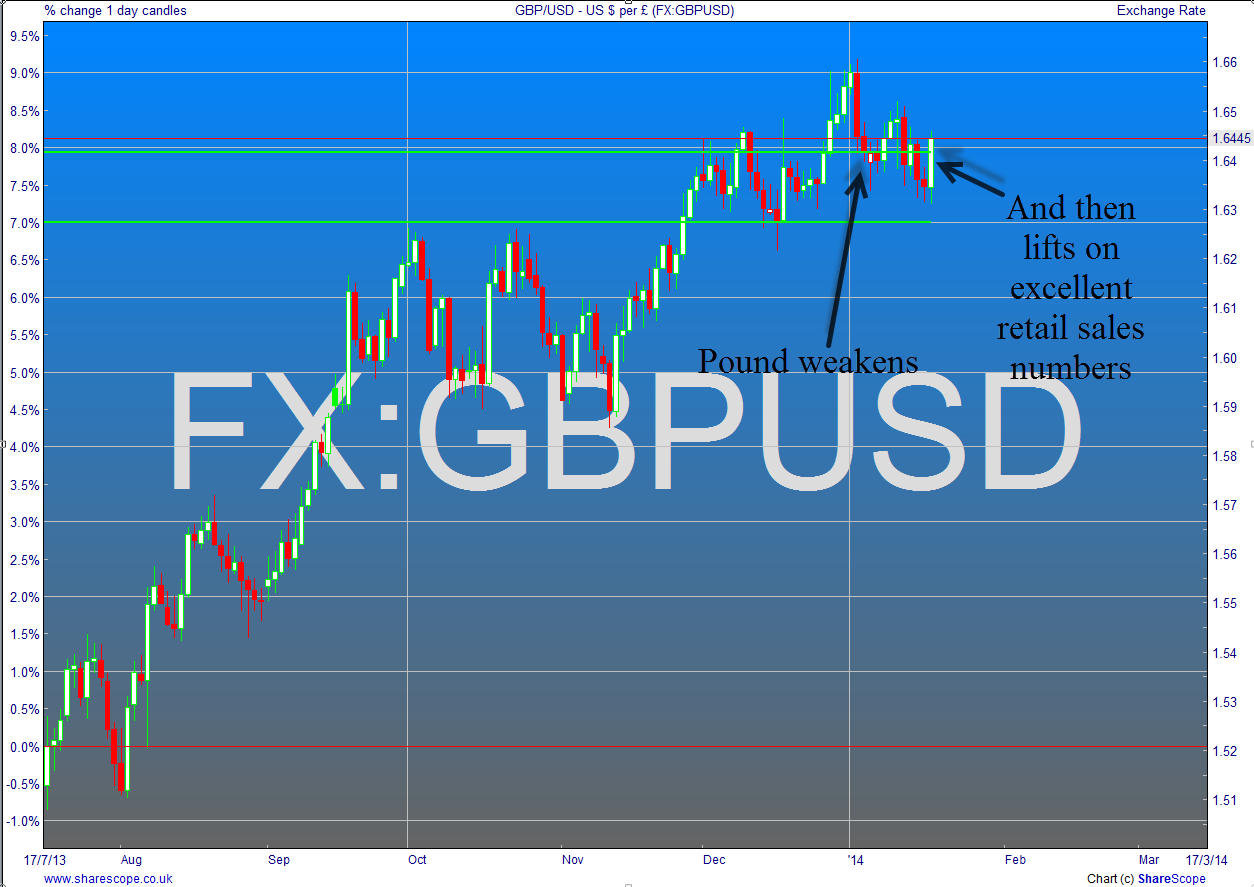
My portfolio has been helped by a strong recovery in the dollar which was going really well until excellent retail sales figures, announced this morning, gave the pound a terrific lift.


Tuesday 14 January 2014

Monkey business and rain

I have been uncommunicative because a string of domestic mishaps have occupied my time, my mind and have sapped my emotional energy.

It started innocently enough with a water softener giving up the ghost. At eleven years old it was to be expected. Then there was section of our roof that failed. It's made of Cotswold stone tiles. Not a cheap repair. Then, we were greeted, on our return from holiday, by a fridge freezer that threw in the towel. We are still awaiting the replacement.

And there was the rain, which has been relentless. It finally made unlikely inroads into our house. The first attack was in the conservatory which fell victim to such high levels of condensation that drips soaked the furniture below and lay in puddles on the floor. A dehumidifier solved this problem but it had to be bought, and we were lucky to find one of the last modestly priced heavy duty versions in the country in a local store. An amazing piece of kit. Strongly to be recommended for any type of damp.

The latest hit was the high water table which caused water to seep up through the floor in a corner of the house. It's surprising how much drying out of carpets etc a small leak generates. It only lasted a day but I am now armed with incontinence pads to suck up any new incursions. I trust they will not be needed.

I know that none of this matches the chaos faced by victims of floods or of the terrible low temperatures facing those of you in the USA. Nevertheless it disrupted our lives and kept us on our toes.

Luckily all of this time the market was treating me kindly. My share picks were going great guns and I have cleared half of my losses for the financial year. (Losses made early in the year by my willful refusal to believe in the rally that was going on all round. Big, big lesson: FORGET THEORY, USE YOUR EYES.)

My share picks were excellent in all areas. They yielded decent returns despite the flat market. There were black days but good ones followed. Which makes me wonder about price movements yesterday which switched from good to bad as the day progressed. What makes yesterday different is that the markets dropped out of their trading range.

It is interesting. There is a theoretical explanation for the shift. The employment figures in the US, published on Friday, were significantly worse than expected. The reaction to the results, if that is what it was, did not come till mid morning (Eastern time) on Monday. That makes me think that something else caused the fall. Particularly since it could be argued that poor figures will slow the rate at which the tapering of QE will proceed. The chart of the DOW shows that the market still has a little way to go before it breaks support.


I'm holding on and keeping my fingers crossed that I will not be forced to bail out. You all know me well enough to know that I can make that sort of a decision in an instant.


To end this post on a positive note after all that gloom. Last week my
daughter rang to suggest a trip to Monkey World in Dorset. It was fabulous. The thing that stood out was the beautiful relationship between two monkeys of different species. Here are a couple of charming
pictures taken by my son-in-law.

I don't know how to persuade the blogging program to put in the pictures any more tidily than this.


Wednesday 8 January 2014

Grinding halt

The big news will be tonight when the FOMC produces its minutes. The long awaited tapering of QE began a month ago with barley a murmur from the markets. Today we shall see the minutes from the meeting which set that tapering in motion. We may the understand more about how policy makers are thinking. I think we will remain n the dark. Bu the market reaction indicates that investors are uncertain about what will come next.

The effect has been to bring december's rally to a grinding halt.


I have said that I feel reasonably confident. As a share picker I should be able to make some money as long as the market does not make a sharp reversal. I have gone for broke. I am now fully invested. The balance of my portfolio is as follows: UK shares 36%, Chinese shares quoted on the US market 48%, US shares 16%. They are mostly shares picked using Vector Vest which has enabled me to use selection criteria which have worked well in the past. I have held my Chinese selection for 4 to 6 weeks and they are showing a return of 6.5% for that period. (It's not a good idea to annualize these returns since so much can happen in a year, however, for what it's worth this annualizes to over 60% pa). The US shares I have held for about 3 days and they are making progress. The UK shares I have also held for just a couple of days and they are up 2.1%. Long may that last!

I have two UK shares which I have not included in the analysis of returns. The largest is  GVC which accounts for 15% of my portfolio is GVC which trades on a prospective PE of 8 and yield a 13% dividend on my original purchase price. They don't come along very often like that but when they do you jump on them.


Thursday 2 January 2014

Happy New Year


Happy New Year to you all! Hope your holidays went well. I went to Seville which was great. The weather was fine except on Christmas Day. There was loads to see and visit. The first night we went to a flamenco display which was brilliant. It seems that an essential ingredient is that the dancers look ravaged as they perform. The speed of the footwork is unbelievable.

Flamenco dancerFast footwork is going to be needed to navigate through the choppy waters of the stock market too. (I love those mixed metaphors). The markets powered ahead in an almost unbroken move right up to the end of the year. And then today they came down with a bump.
Some of the biggest falls were seen in Europe with the Dax falling 2.5% on the day and the CAC falling 2%. The Dax pull back was from a new all time high. 
The US markets also drew back from all time highs but the falls, so far, have been smaller. I am not sure that today's fall represents the end of the bull run. The first quarter of the year is normally a good time and I certainly hope that this year will not disappoint.


The UK market has not been as buoyant as some others, but it is possible that it will catch up since the UK economy appears to be in more robust health. The pound has reflected this in an amazing rally against the dollar for the past six months. I am lucky to have been making money in my Dollar denominated shares, when I value them in pounds, despite this headwind that I have been facing.


Having spent the last months of last year dithering about where I should invest my ISA money I have finally plumped for the UK. No exchange rate penalties just the stamp duty to pay. I have also found a share picking strategy that has yielded an average rate of return of 11% for the period January to April over the past 7 years. Over the same four months the FTSE 350 has yielded just 0.7%. 

I have made my selection and have bought RDW JD BWY XAR BKG. Fingers crossed.

Here's how the FTSE looks.


And then there are those Chinese shares. They are still doing fine. HTHT had a spectacular run up just before Christmas and this time I took the profit: 19.8% in one month. I have bought back in at a lower price. I have a similar issue to resolve with EJ which is up 21% in a month but there was no sudden surge so I don't feel the same urge to take profits. Hope I'm right.