Friday 28 November 2014

The winter bugs return and oil prices slide - who wins who loses?

I have been laid low by a second attack by one of those ghastly winter bugs. This time it was bad enough to merit a doctor visit and that resulted in a course of antibiotics which killed off the bacteria that had snuck in, taking advantage of a compromised immune system. (see below for a plug for the British National Health Service)

Oil


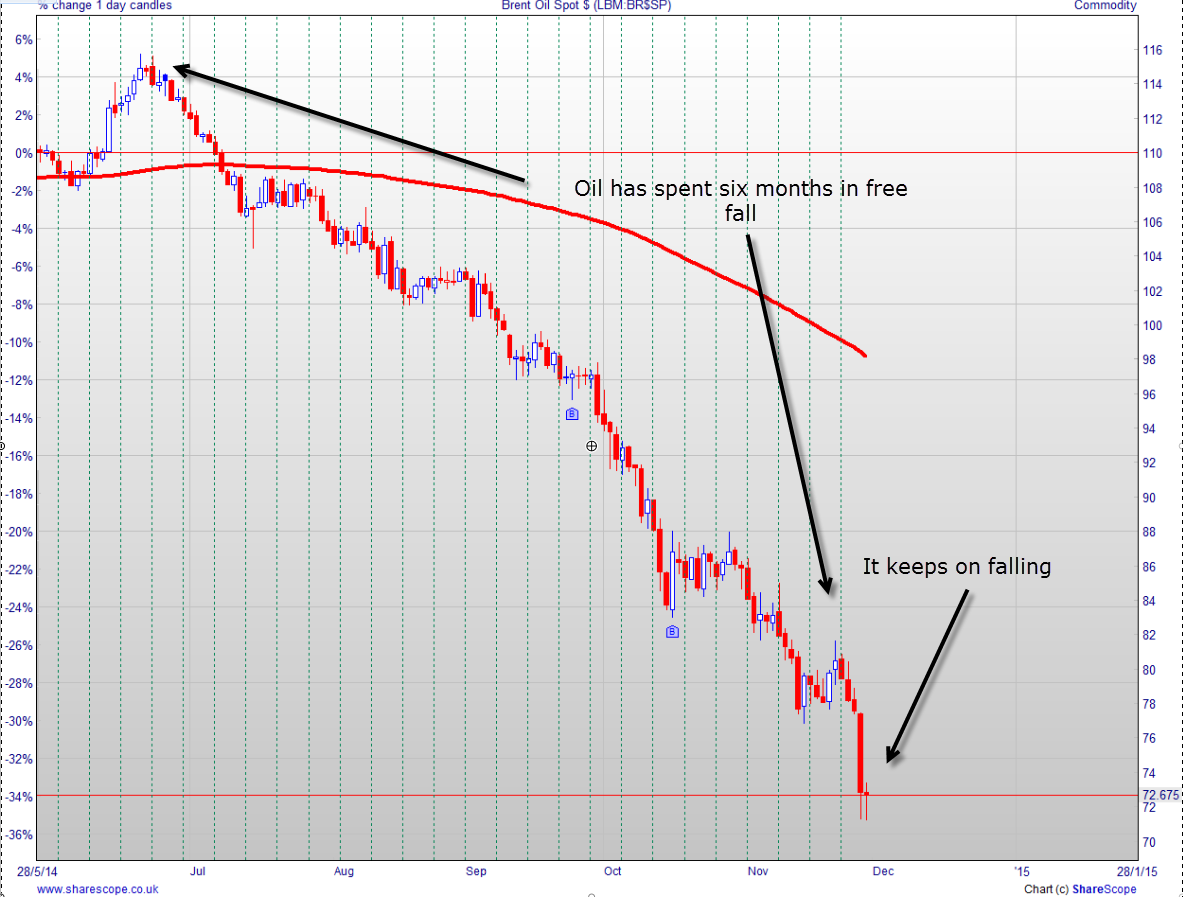
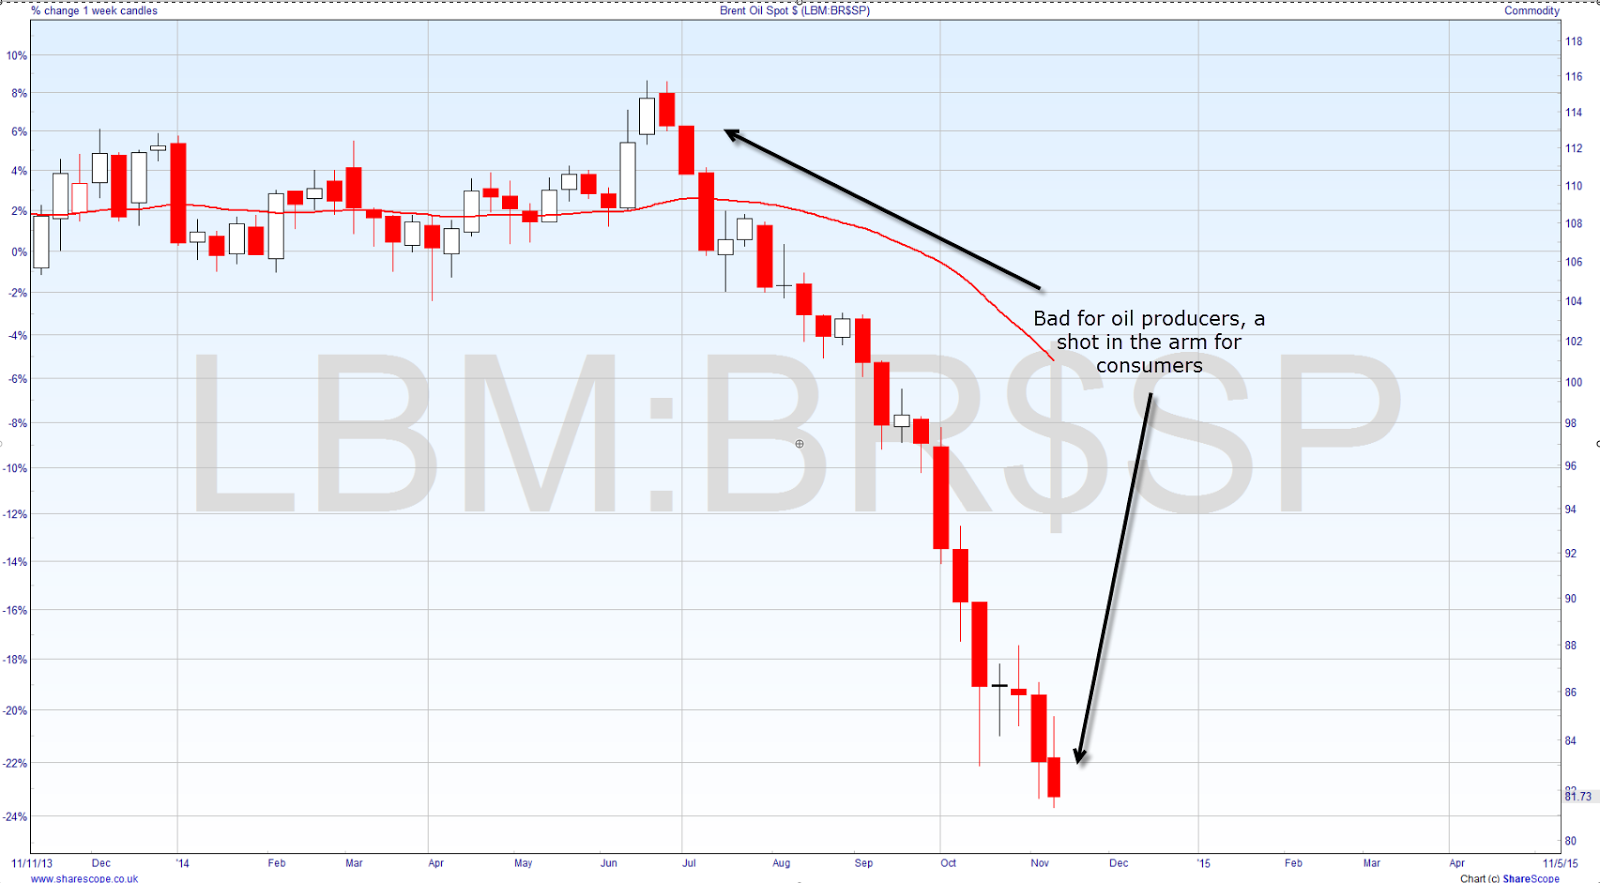
Enough of that. The big big news is that oil prices continue to plummet. My theory, and I have no evidence whatsoever, is that it is a concerted plan on the part of the top oil producers and their close allies. Objective: provide a boost for friendly economies around the world and attack and destroy three groups of competitors:

  • First, the producers of alternative energies - wind, nuclear, solar, shale gas etc
  • Second, oil producers with significantly higher marginal costs of oil extraction and excessive government expenditure that has been funded by good oil revenues
  • Third, oil exploration companies
Reuters has just published the following table of marginal costs for producing oil:


Marginal cost of producing one new barrel of oil
 Regions                      Dollars per barrel ($/bbl)
 Arctic                                 115-122
 Brazil Ethanol                          63-69
 Central and South America               29-35
 Deepwater Offshore                      54-60
 EU Biodiesel                           106-113
 EU Ethanol                             98-105
 Middle East Onshore                     10-17
 North Sea                               46-53
 Oil Sands                               89-96
 Former Soviet Union Onshore             18-25
 Russia Onshore                          15-21
 US Ethanol                              80-87
 US Shale Oil                            70-77
 WAF Offshore                            38-44
 
 (Reporting by Rowena Caine in London; Editing by Christopher
Johnson and Dale Hudson)

With Brent Crude prices at $73 we can see that only three areas are not already in serious trouble: the Middle East which is mainly Saudi Arabia and the Gulf States; the former Soviet Union and Russia; and Central and South America. 

Even some oil producers with low extraction costs are in trouble because their national budgets have been set on the assumption that they will be earning high excess revenues from good oil prices. Russia is included in this group of countries vulnerable to the effect of low oil prices. In 2010 46% of the government's revenues came from oil. The 40% fall in oil prices in the past six months will have had a devastating effect.

The strategy of driving down prices by the oil producers' big guns has a terrific logic. They have allowed their competitors to spend on research and development, almost always, funded by government subsidies only to come in at a crucial moment and show who really is boss: cheap oil. 

Just wait. The climate change warriors will be shut out of the debate on future energy because the cost differential between their pet projects and cheap oil will be too great. No more wind farms, and the scourge of ugly solar panel will be over.

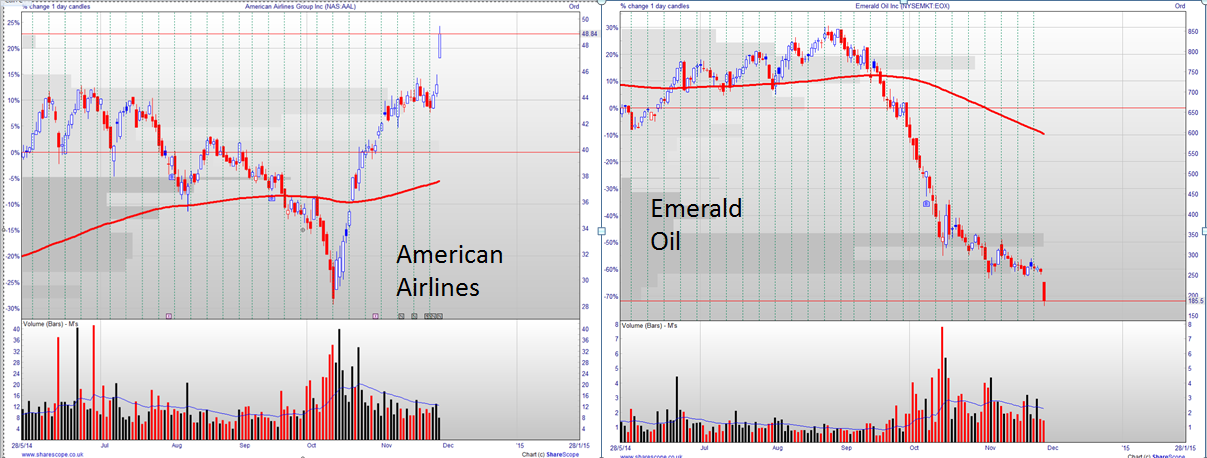
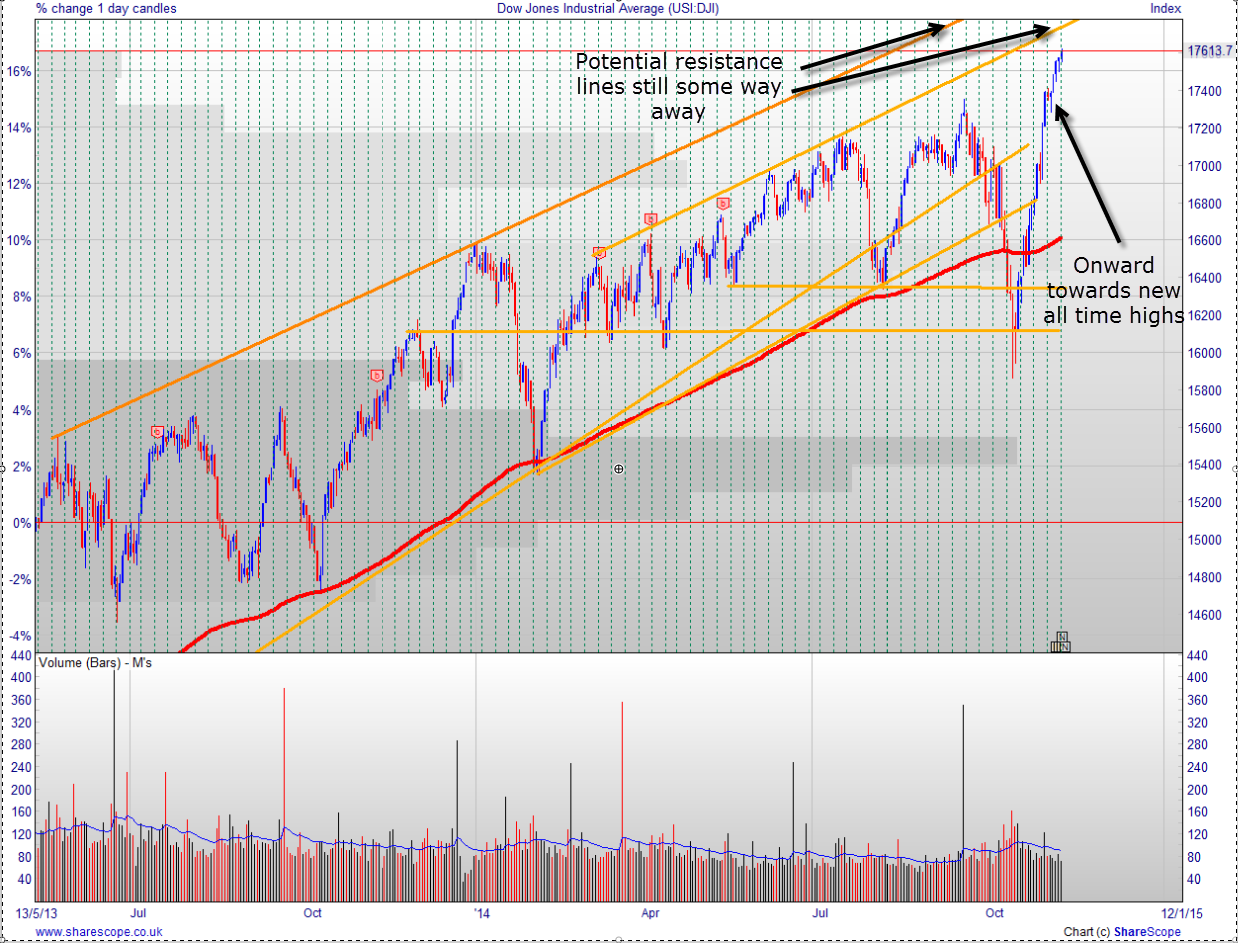
On the plus side cheap oil will help to keep the battered economies of the west afloat and China's cost base will be lowered. With luck the stock market will be buoyed by this unexpected cost saving bonus - better ditch those oil shares, especially exploration companies, and pile into aviation stocks.


UK Health


As an aside for my American readers I would like you to know that the treatment I received at the hands of my doctor was prompt and delivered partly by phone and partly in the doctor's surgery by a qualified practice nurse who was warm, caring and conscientious. I did not have to pay a penny for the service or for the medication. It had been prepaid by my lifetime of paying taxes. And my contributions go to providing equally good services everyone who needs them. This high quality of care costs us just 9.4% of our GDP in the UK. In the US you guys spend 17.9% of your GDP on health and according to Gallup over 13% of  adults remain uninsured. It's hard to measure outcomes of healthcare spending but a crude measure is life expectancy which is 80.4 in the UK and 78.9 in the US. I think we get a better bang for our buck.


Tuesday 11 November 2014

Winter is upon us - normally a good time for shares. Short story collection - The Devil in the Detail


The US market continues to make new highs. QE is ended but interest rates remain low and the central bank suggests that they will continue low. Oil prices continue to fall and are now at levels not seen since 2010. The US economy continues to improve. All in all the situation appears to be set fair.


It is also the time of year when stock markets, on average, do best.

FTSE


The UK market has been doing well for a month but needs another 300 pints to break through its previous highs.


So, can we relax? I am fully invested but far from relaxed. I feel the need to make hay while the sun shines but I am watching the sky for the appearance of dark clouds.

To create my selection of UK shares I have reworked my analysis of the best Vector Vest Unisearches. My selection is a combination of standard searches, adaptations of the standard ones and ones that I have developed myself. I tested for the period November 1st to April 5th for each of the years 2008 to 2013. In those years, on average, the index moved up on average by 3.7% over that winter period. My shortlist of unisearches rose by between 5.5 and 26.5%. The standard unisearches that I tested were Southern Comfort UK which achieved 15.9%, SuperStars which made 15.8% and Hidden Gems which made 15.3%. Clear winners were, however, adaptations of Southern Comfort and SuperStars where I added conditions that picked shares that already showed significant momentum. These two searches yielded back-test performance over the past five years of 26.5% and 21%. The shares I picked using these tests are IAG, EMG, PHD, FLYB, INL, LMP, and TSTL. All, with the exception of LMP are proving winners with an average rise of 2.5% in the space of about a week.

Hard times on US market


I have had a torrid time with my US shares. I have had to pull out with serious losses from attempted campaigns in mid September and early and late October. No fun at all!

My latest campaign, which began at the turn of this month is doing better. Up by just over half a percent. I have chosen to buy large selections of shares in small quantities. (AA  AAL  AAPL  ADHD AMZG  BRIT  BSX  COP       CVX  EOX  FTR  GASL  GDP GERN GILD HBAN HCBK  HES  LYB MNDO  MSFT MU NSPH  ORCL RFMD RPRX SLB  SNSS  WPRT ZAZA)

I have gone for US shares purchased using unisearches that have done well in tests for the November to April periods in the past six years. These are Jail Break - No Contra ETFs, AC's Percent Price Poppers - RT Asc, Blyar's Bottom Feeders/BMB, Russell 2000/RT, Rob's Raiders, S&P500 - Stop ASC all of which have yielded on average well over 30% returns. Even better was an adaptation of The Comeback Kids but this generates lists of very risky shares..


China


I hope that this time my timing is right. I also wonder whether I should revisit Chinese shares in the US market since the Chinese stocks seem to have staged a major break out.


So that is where I am now. I hope my instinct for believing in a good winter to spring period will stand me in good stead. I need some luck.

The Devil in the Detail

A couple of years ago I wrote a few short stories and I have decided to publish them. If you are interested they are available on Amazon under the title The Devil in the Detail


in the US the link is Devil in the Detail

Thursday 30 October 2014

Enfin

Or 'at last' as we say in English. Yesterday came the announcement that QE in the US is to be retired. The market took the news in its stride since it was well anticipated.

The announcement came with the promise that interest rates would remain low. This was designed to avoid panic as the tap pouring out cheap money was turned off.

There was, however, a change in the FOMC's view of another important indicator. They said that "underutilisation of labour resources is gradually diminishing". This is code for "there may soon be a shortage of labour and wages may begin to rise". So what we have here is the first admission that the specter of inflation may be poised to reappear.

At present the commodity markets are benign. Oil prices in particular are low. In a list of unleveraged commodity exchange traded funds (ETFs) only 16 out of 70 are up on a year ago and of those 6 are concentrated on the livestock industry. Others that have risen include coffee, zinc, cocoa and nickel. The big losers include sugar, wheat, other grains, precious metals and most importantly of all oil and its derivatives. The low prices of these important staples means that we are currently living abnormally cheaply. Any change in this benign situation, together with potential wage inflation could lead to inflation, a rise in interest rates and that would be the end of our bull market for sure.


All credit must be given to the central bankers for inventing QE. As a method of keeping a financial system, that had driven itself onto the rocks, from sinking beneath the waves it has performed superbly. Naysayers, and I include myself, have been proved wrong. The system did work and the UK which used the same strategy now has one of the healthiest economies in the West. The Euro Zone is embarking on its own version of QE.

We still don't know if the world economy will survive without the crutch of QE which transferred such huge sums of money from the state sector to private businesses and pushed the stock market to record levels. What we can be sure of is that the flow of money which found its way into the world's market has now been switched off. The supply/demand balance has been changed: no new money no new demand.

From now on we must listen even more carefully to statements by the World's central banks to see what they plan to do to keep the vehicle on the road.

Monday 20 October 2014

Struggling to turn theory into practice

I continue to be impressed at how well those support and resistance lines work. Just look at the chart. I'm not cheating, I drew that line last Wednesday as higher levels of support gave way. Intra-day the level was pierced but by the end of the day the market rallied to settle on that support line. And then on Friday the rockets fired and we were on strong positive territory.

I placed support at around 16111  based on resistance encountered last November which turned into support that held the market twice in March and once in April.And that turned out to be where the market turned this time round.


I got it right with the FTSE too picking a support level around 6200. I described it as 'unconvincing' since it was based on just three previous support points back in April, none of which looked significant. As it turned out, that level held too and it looks as though today we'll see some follow through from Friday's upward thrust.


Struggling to turn theory into practice

The analysis method works well, it seems. But the big problem is how to turn theory into practice. Often I do not have the courage to believe my predictions and to trade in anticipation. Occasionally I do and I pick my moment badly and the turn I expect does not happen. Burnt fingers.

So then I see a potential turn and wait for confirmation. Result I am too late to the party and fingers get burnt again.

Trading in a choppy market is no fun. Oh for a nice smooth trend like the one I was too fearful to join that has dominated the US market for the past two, or is it five years. I have managed to pick bits of it successfully but not nearly enough to make for a happy life.


Thursday 16 October 2014

Update: free-fall or correction?

Too early to say whether this is a correction or the start of the fall that is bound to come, The free money fest provided by QE and long term low interest rates will end eventually . When it does there will be a big reevaluation of stock prices. Is that happening now? Still hard to tell.

What is interesting is that the support lines which I identified and put on yesterday's charts are holding the market slide for now. Watch out if they are broken.


Wednesday 15 October 2014

I jumped the gun and am now in deep water. What now for the DOW and the FTSE?

Tough blog to write this one. I have been unwell and out of action for a few days. Nothing to do with the pea and and mint pasta I hasten to add. When I am unwell I find it hard to make decisions. Instead I let things ride. This was the wrong moment to do that.

At the beginning of last week I had the impression that the pull back in markets, which had been running for a couple of weeks, would be short lived. No harm in that but my mistake was to jump into the market in anticipation of a rise instead of waiting for confirmation that the the recovery had begun. I held on, fell ill and the rest is history.

I finally pulled out yesterday, nursing some nasty wounds. Have I pulled out just as the market was about to turn? It looked as though I had as the market spiked upwards during the day. But by the end  it had pulled right back and I was glad I had decided to bite the bullet. Obviously an earlier exit would have been better but there is no point in wishing for something you failed to do.

It is a common mistake to hold on to losses because "in the long term good shares will come back". This may be true, but the long term is an indeterminate period and it may be very long indeed. If trading costs are modest and there are no tax implications it is probably best to pull out and return to the market when conditions are more favorable. This has two advantages

  • if you really are in a period of serious pull back you should be able to reenter a position at a lower price
  • by the time it is a good idea to return to the market there may be better opportunities and you can recover your losses faster by buying faster moving shares.
So that's where I am now. Next question: What does come next?

What now for the Dow?

The Dow has pulled back 6% since its high on 19th September. Its biggest fall was 340 points on 9th October but there were several other big down days. There were also 4 recovery days early on, so during the early part of the slide there was definitely a battle between the bulls and the bears. The bears are starting to have it all their own way on modestly rising volumes. 

The other worrying factor is that two diagonal support lines have been smashed and a horizontal has just been broken. If we see no recovery now the next support is 200 points away at 16111.


And what of the FTSE?


The FTSE has fallen by 8.5% since the high on 4th September. Why so much? After all the UK economy is leading the world in its recovery. That is one of the big stock market paradoxes. Strong economy leads to weakening share prices. It is not such a mystery when you take into account the fact that interest rates affect share prices. Higher interest rates, or threat thereof, mean that the returns offered by shares are reduced in RELATIVE value. If you can get a better return from risk freeish bank accounts why take the risk of holding shares?

So the FTSE's slide has been accelerated by the threat that a recovering economy will allow the Bank of England to raise interest rates. This explanation has been dealt a blow by the lower than expected inflation rate announced yesterday. But we are still in frightening territory.


Monday 6 October 2014

And up again - Pea and mint pasta recipe

It looks as though that last pull back was rather short lived. What we do have is a rather strong signal that our most recent low was higher than the previous one and that we could have a new buying opportunity. Hard to say how long it will last. It is likely to make a new high though.

The fact that I pulled out of my US shares does not worry me at all. The costs of trading in the US are low since there is no stamp duty to pay. Broker's fees are low too and spreads are minimal. I'm going to be looking for shares that were beaten down in the last pull back and are due for a nice rebound. I could be buying from this afternoon onward and expect to be fully invested by Wednesday. I suspect I need to move fast because this rally may be short lived and I will be taking my profits even more quickly than I did in the last rally. This time I will be grabbing the money as it comes and will not be waiting for the inevitable pull back.


I have held onto more of my UK shares since they have been doing better. But I still have some cash in that portfolio which I will reinvest. I'll let you know what  I have bought and when.


Pea and mint pasta

Another great vegetarian recipe for four people.

Use 350 gms any type of pasta shape that takes your fancy and cook as per the timing recommended on the packet. Add 200 gms of frozen peas per for the last minute of cooking.

In the mean time prepare the sauce. Blend about 200 gms of crème fraîche, 300gms of thawed peas, 100 gms grated mature cheddar, the leaves from a bunch of mint and salt. Blend until smooth. When the pasta and peas are cooked scoop out a mug-full of the cooking water, drain the pasta and return to the pan. Add the sauce and add the reserved water to achieve the consistency you like. Mix thoroughly and serve.

Wednesday 1 October 2014

Down we go

The instinct which told me to pull out seems be the right one. I sold out of my remaining US shares today and am only keeping the rump of my UK ones because, for the moment, they seem to be holding up in the face of a dreadful FTSE performance.

The chart tells it all. The slide has taken it to withing 20 points of the previous low and it looks very ugly.


The Dow is making a second attempt to break through a two year old support line. It's a time to hold back and await developments. It is unclear what has spooked the market so it could still go either way. That last high should have been higher if the market was still on a roll. Time will tell. In the mean time it's best to be sitting on the sidelines.


Friday 26 September 2014

Bad timing, nasty volume spike, where now?

US Market

My return to the US market could not have been timed much worse. I started losing money as soon as I bought my shares. And then on the Monday the Dow did its first big dive. I backpedaled hard but it was too late, the money had gone.

Should I have held on? I think not. Why? A friend sent me a copy of MoneyWeek Trader published on 24 September suggesting that the financial disasters emerging at Tesco could be the catalyst for financial meltdown. I personally do not believe that Tesco is a big enough player on the World markets to have that sort of impact.

I had spotted another event that, to my mind, had greater market breaking clout. That was the great yawn that Apple's latest new product offer engendered. For years now Apple has pushed forward the frontiers of technological innovation.  Perhaps not in terms of actual hardware or even software novelty, but certainly in terms of marketing, style and fashion. If that company had lost its touch this could spell the end of the rapid turnover of products in consumer's pockets. If automatic upgrading comes to an end there will be a big slow down in turnover and businesses all over the world will suffer. The end of the line for that particular gravy train?

Even more significant to my mind was Friday's market action. Just look at that chart. Friday 19th showed a shooting star on massive volume. These volume spikes are warning that a big change is about to happen. And although Wednesday saw a recovery after the 215 point drop on Monday and Tuesday. Yesterday saw the sellers back with a vengeance. There is a support line close by and it looks as though today will see a bit of a recovery (based on the futures data). But I don't expect this to last.


UK Market


My UK portfolio is holding on to its gains pretty well despite a really ugly UK market. But I can't see that going on much longer. So a tidy up is needed there too.

GVC has come up with yet another sparkling set of results. As might be expected profit taking is pulling the price back. But I'll just hold on. There was yet another special dividend on top of an already chunky quarterly pay out. I just don't want to let go of this holding, not for any emotional reason but because of the dividend I am getting. I built up my position over a long period so It's hard to say what return I am getting, but on a purchase price basis it is running between 12 and 14% and it keeps going up. Even at current prices the full year's dividend looks like a yield of about 9%. You can't argue with that - the only possible fly in the ointment is unexpected bad news.

Friday 19 September 2014

My confidence returns

I have not been out of the market for long. I cashed in my profits on September 9 and here I am, just 10 days later, climbing back on board.


My selection is different. The China market is not such an obvious good bet so my share picks are spread between China and other US stocks. This is partly because my favoured Vector Vest selection systems are throwing up some China shares. I have also repurchased some shares from my last batch that just look good. Here is the current list. VMIC IG SINO MOBI AMCF GILD LUV GBX SKX AVGO BIDU BITA XRS.


There is one share I must mention VMIC. If I had held that through the recent bad patch I would have tripled my, already substantial, profits on the share. A staggering 133% in total. Instead I let it go after I had banked 32% (and that was in 2 weeks). However there was no way of knowing that was going to happen. On the whole I made the right choice for without that share's move I would have lost half of my profits. I play this as a game of averages. Finding just the one big winner is playing the lottery and I try not to do that.

(Though my stake in GVC is just that. I played a lottery number and it has paid off. But shares that look like that are hard to find.)

The Scottish referendum has proved to be a one day wonder and I have a number of Scottish friends, who live in England, that have breathed a sigh of relief. The market has not really reacted at all. Yes it has shot up but it would probably have done that anyway.


Monday 15 September 2014

Just in time?

Liquidation day


Last week I pulled out of the US/China market banking 5% profit in about 6 weeks. It looks as though I was just in time. At worst I would have lost two thirds of my accumulated profits in the three days following disposal, As of today, following a slight recovery, I would have lost about half. Of my 20 positions only 7 are up on the liquidation price. And only one, VIMC has made significant headway.

Of the portfolio 12 were winners and 8 losers over the six weeks while I was holding them. Biggest profits were made on BITA 59%, VIMC 33% (That would have gone on to make 58% if I had held on). Two more holdings made more than 20% and another 2 made more than 10%. On the downside there were four 15-20% losers.

I think this is an endorsement of my shotgun approach to picking shares. I look for a selection system which has a good backtest record, and a sector that looks promising and then buy a large assortment. There will always be losers as well as winners and, in advance, its impossible to distinguish the sheep from the goats. You buy the flock and hope that the majority turn out to be sheep.

Market situation


Just at the moment the major markets (US, UK, DAX) seem to be stuck in a rut. The BRIC markets have taken a tumble of over 5% and Hong Kong is looking ugly too. China is struggling. Only the Nikkei is making progress. For a change here is the FTSE All World Index which shows the current pull back.


Both long and short term US treasury bonds are falling in price signalling higher interest rates. The chart below shows that bond prices have been weak since the beginning of last year but have recently staged a rally. It looks as though that rally may be faltering. Higher interest rates spell doom for the stock market.


All in all a depressing picture. I am glad to be sitting on the sidelines with my US portfolio.

My UK selection continues to hold firm and I have made my target 17% return on that holding since April. The shares I bought starting in July are up about 8% in 10 weeks. I like the fundamentals of my shares so I am sticking with them but I will run for cover at the first sign of trouble, as I did with my US shares.

Here are some more San Fransisco murals


Tuesday 9 September 2014

Loch Ness Monster Sighted

I have made no secret of my scorn of the news as a guide in guessing what will happen in the markets. But is my cynicism misguided? With days to go before the Scottish referendum and the first signs that the vote for a separation might be going the way of independence seekers the headlines scream that the pound is collapsing in value.

Indeed the pound has fallen by an eyewatering four and a half percent against the dollar in the past three months. But consider the following table

Percentage currency movements against the US Dollar
3 month 6 month
GBPound -4.50 -3.50
Euro -5.25 -6.50
Yen -3.50 -2.75
Ausie Dollar -0.75 2.75
Canadian Dollar -0.75 -1.50
NZDollar -2.50 -2.50


I would argue that far from spotting the Loch Ness monster we are seeing something altogether more frightening. The currencies below the gap, in that table, are know as commodity currencies while those above the gap are not. The commodity currencies are holding their own against the USDollar, just.

The movement of the pound, far from showing exceptional movement plods on in the midst of its peers. All those non-commodity currencies are showing a serious weakness.

I interpret the figures as a frightening flight of money to the US. Frightening because US bonds are seen as THE safe haven in times of trouble.

The US Stock markets may be in the region of all time highs. But with smart money running for cover should we be following it now? Based on what we are seeing in the currency markets perhaps we should be getting our running shoes on..

My portfolio


I'd like to think not because I am doing so well and, at last, am outperforming my benchmark, the FTSE 100 when measured by my portfolio overall.

My US/China shares have been the big contributors in the past few days. Have  look at the table below. Even if you subtract the losses already taken on a few weak shares, I am still up almost 7.5% in about a month and a half.

Unfortunately I have to set early year losses against this and when those are included I am still down 3.5% on my US/China portfolio since April. But it would be sad if the progress I am making to wipe out those losses comes to a grinding halt.

24-Jul MNK 15.5%
24-Jul act 12.4%
29-Jul BIDU 5.1%
29-Jul BITA 69.2%
29-Jul NTES 8.5%
29-Jul NOAH 0.4%
29-Jul FENG 0.8%
29-Jul YY 26.8%
29-Jul VNET -1.6%
29-Jul VIPS 4.0%
29-Jul XRS 31.2%
29-Jul WBAI -4.1%
11-Aug STV -14.2%
11-Aug KNDI -12.9%
11-Aug HOLI 4.1%
28-Aug ATHM 2.6%
28-Aug VIMC 38.9%
28-Aug CSIQ 14.2%
28-Aug TEDU 19.2%

Average 9.1%

San Francisco Murals


Here are a couple more of my photos of murals in San Fransisco. (see yesterday's post).


Wednesday 3 September 2014

The World with its erupting boils, the blithe spirit of the stock market (and a couple of pictures)

I'm writing these posts less frequently. Probably because it's summer time and in theory less is happening. In fact there a lot is going on.

The World with its erupting boils


The world is in turmoil. A million refugees have found themselves displaced by the Ukrainian conflict. Hard to say what is actually happening because of disinformation being generated by both sides. I said, at the time of the Russian annexation of Crimea, that I thought that Putin is testing the resolve of his opponents to see how far West he can push the frontier of his sphere of influence. Nothing has happened to change my view. Putin has found that his enemy is irresolute and it looks as though he will be able to push forward to capture the Eastern portion of Ukraine. He'll then be able to move on to test other weak spots that were formally parts of the Soviet Union.

The crisis in the Middle East is more frightening. Bush and Blair created an crack in the fabric of the area and militant Islamists are taking full advantage of the vacuum that has been created. It is sad but true that only in Egypt, where the old military dictatorship has been revived, that an effective counterattack has emerged. The vicious Assad regime is fighting back in Syria but it lacks friends and the West has supported rebel groups allowing Islamists to take the initiative. Similar slippage has occurred in Libya which now seems to be sliding into anarchy. The government of what remains of Iraq is struggling and an alliance between its Shia majority and Iran seems to me to be a likely outcome. Iraq's moderate Sunnis are trapped between a rock (the Shia majority) and the hard place (Islamist Sunni insurgents). So far the problems have been confined to the area but it is only a matter of time before they spill out to affect the rest of the world.

Blithe markets

And through all of this the world's stock markets, buoyed by a continuing flow of almost free cash provided by central banks, push on regardless. Only today the FTSE made a new high for this cycle. The S& P continues higher and higher. Only sensible strategy: make hay while the sun shines.


But I wonder what it is that Western governments know about the underlying realities of their economies that makes them feel the need to go on providing the crutch of QE.

My portfolio


It is my UK portfolio  that has done best. Just look at the table below. It shows how much my selections have moved since I bought them, or since April 6 (for those I have been holding for longer). GVC has also had thrown in 4.7% worth of dividend. I sold OMI for a small loss but overall I am more than happy with my little band of companies.

21-Nov PLE -8.2%
05-Dec GVC 15.9%
01-Jul EXI 2.3%
01-Jul WIN 0.8%
01-Jul BRIT 4.1%
01-Jul CAML 3.8%
11-Jul GEMD 21.4%
22-Jul RNWH 24.0%
05-Aug PUR -10.1%
11-Aug NFC 8.7%
11-Aug AMER 0.8%
28-Aug CRPR 3.8%


10.5%

My US/China portfolio is not doing so well. It has had  dodgy patch which came to an end yesterday. That said it is up over 2% in a month. The recovery of the Chinese market has probably contributed. You may remember that I bought just as China spiked. My shares managed to make gains as the market retreated but then there was a pull back.


What I found in San Fransisco


I have been sorting through my photos of a trip to California we took a couple of years ago Among them are some pictures of the fabulous murals, some professional, starting with those created by Diego Rivera in the 1930s and continuing to the radical productions of anonymous artists working today. 

I plan to share some of these with you over the next few posts. Today I have one by Rivera and another that celebrates the beginning of that sadly misnamed phenomenon: The Arab Spring. I hope you enjoy the pictures. 


Wednesday 27 August 2014

How high can we fly? and the psychological development of markets

Little has happened to my portfolio since the last post. That is to say ups have been balanced by downs. The main change has been a pause for breath by the dragons of my UK portfolio and nice run up by my China/US shares. They are now up by almost 3.5% in just under a month. (If that went on for a year it would be 42%). Big if, but still a nice reflection on my share picking given that the US market has seen much less than 1% move in the same period and there has been a 2.5% fall in the Chinese market.

Conclusion: steady hand on the tiller.


The evolution of bull and bear markets

Crowd Money draws a parallel between the emotions of the market and those proposed by psychologist to describe bereavement.
  • as the market moves from one wave to the next, first there is disbelief. The mood of the vast majority
    of the market crowd is that the last move, up or down, will not end. It is only the very brave that will take contrary positions and they are derided as delusioned mavericks. They find it hard to stand out and the positions they take are small reflecting the perceived level of risk.
  • acceptance  follows as people begin to make money and take ever larger positions. This is the period when buy and hold strategies yield good returns.
  • growing profit balances, encourage the view that the trend will never end and euphoria takes over. Price appreciation is seen as a certainty and large positions, including those financed by margin are taken on. The crowd rushes on oblivious to risk.
  • eventually demand, or supply is exhausted and the market begins to turn. Positions are liquidated as stops are hit and we move into a new period of disbelief.
  • renewed acceptance follows. It is important to note that the fear engendered by a falling market is a more powerful emotion than the greed that fuels a rising one. So prices fall faster in a bear market than they rise in a bull
  • following the sharp fall of the bear a period of depression follows when the crowd cannot believe that we shall ever see a recovery.

Sunday 17 August 2014

Unrequited love and the picking of shares

USA/China


At last my portfolio is making a little progress. This is happening on the UK side and the US. There are several factors which are helping.

First my assessment of the overall market worked out. I made a good guess that 16300 was a key level for the market in this latest viscous pull back. The Dow turned round at 16332 after a near 5% decline from its all time high. I bought on the way down, mostly on the 29th July but, as you know I picked Chinese shares. My guess that there would be a turnaround in the US market kept me in the bulk of my trades despite initial losses which, without a belief that this was not the beginning of the end, would have sent me scurrying for the hills. The net result is that I have 1.2% in profits in just 2.5 weeks. The scales up to 25% in a year - comfortably within the range that back testing predicts using Vector Vest.


That result includes nasty realized losses which I took on certain internet real estate shares. And it includes some shares which I have only just bought and which are still carrying unpleasant early losses. The big movers are BITA which is up 37% and XRS at 22%.

The realized losses would have been reversed had I held my nerve. I sold because of a negative article published in Seeking Alpha, a web site that publishes reports by all manner of commentators. I suspect that it includes rampers and short sellers as well as proper analysts. It's the second time I have been caught out by reading some of their stuff. I should be more careful.

UK

My performance in the UK has been equally good. I exclude GVC wich accounts for almost half of my UK holding. I picked it for different reasons from the rest of my UK portfolio and is doing very nicely thank you. 

I began my buying campaign on 1st July and a third of my new UK holdings date back to that time. On average my holdings are 3-4 weeks old. In that time they are up by over 5.5%. On an annual basis that
equates to over 80%. And this was in a period when the market fell by 1.5% overall but with major rises and falls in between.


Top performers are GEMD, up almost 20%, RNWH up 17% since 22 July, OMI up 14% since 30 July.

They were purchased using my old time tried and tested share picking system which, unfortunately cannot be back tested by Vector Vest. VV does not allow testing price movements relative to the market, nor does it allow the testing of cash-flow per share compared with earnings per share and its measures of PE and eps growth are obscure so I cannot check if they are comparable. These measures are all integral to my UK share picking technique.

Share picking


What is important is that this share picking system has kept me solvent and happy for 17 years. I have enjoyed a very comfortable lifestyle all of that time based exclusively on my share trading which has this share picking methodology at its core.

My approach to share picking is, and always has been, shot gun rather than sniping. I use a system for picking shares that I know works on average and buy at least five shares at a time which have the characteristics that predict, on average, that they will rise in the next few weeks or months. The proviso is that there is no general pull back.

My miserable performance over the past few years has been the result of my continuing but mistaken fear that the market would pull back. When I have had the courage to be active in the market, for example in 2012 I have performed up to or close to my average performance of 14% pa 1998 to 2013 (17% pa up to 2010).

Why we grow to love our shares

Treacy, in Crowd Money, talks of the problems from which investors suffer. He quotes a seminar delegate who said he found it much harder to sell shares than to buy them. Treacy's analysis is that rather than thinking of greed and fear as driving investment decisions, impulses which best fit the economist's view of market activity, we should use love as the best emotional analogy. 

When we fall in love we are overwhelmed by elation. We have made a choice of companion and we look
forward to a happy, exciting and rewarding relationship. This is paralleled when we buy a share. The good feeling beds in as profits role in. The thrill of the buy is in contrast to the dismay when things begin to go wrong. These are the emotions of a jilted lover. Loyalty goes unrewarded and a feeling of shocked ambivalence takes over. Disbelief makes the investor hold on too long. Too much has been invested in the relationship and it proves hard to give up. Blame is placed on the instrument, the adviser who recommended the share anything but a willingness to accept that things have changed. It is hard to throw in the towel and losses generate resentment.  Love makes us want to hold on. We made our choice at the outset and we cannot let go of the partner of our dreams. 


Sunday 10 August 2014

Crowd behaviour and its impact on our thinking

Friday's price action shows that the balance between supply and demand remains very much in balance. Since the last high of the DOW there was a week of near stability before a big sell off began on the 25 July. We are now eleven days (two weeks approx.) into that sell off. 31st July was the day of the big move when there was a 300+ point slide.  The four days around the big fall added up to a 600+ point fall. The low was hit on Thursday last week at 16334, 800 points below the high. The fall over the period on the S&P was comparable though the pattern looks different. 


We can no longer rely on coordinated movements in the major markets but on this occasion the Nasdaq mirrored the other US markets and the FTSE fell by a comparable amount. The Nikkei seems to have taken its cue from the US market to began its fall on the 31st July but has only puled back by just over 3%. The DAX, on the other hand, began its slide earlier at the beginning of July and fell by over 12.5%. 


The China market, in contrast, kept going till the 5th August after a spectacular near 13% rise from the 18th July. From then it slipped 4% to its low before recovering on Friday, in anticipation of the US markets. The chart below shows that it is in a very different place. It is a long, long way from its all time high which was way back in 2007. The market is trading 70% below the level achieved in those heady days. Even returning to the nearest local high of February 2013 prices have to rise by 30%.


Friday saw a recovery in the US markets. Too early to say that we are back in positive territory - the futures markets following the close were indicating a pull back. So we just have to wait and hope, if we are in the market.

My UK portfolio took a big hit on the 1st August but that was mostly down to GVC, which dominates that portfolio. There has been a pullback o my other shares too but they are still holding their own: 5 winners 4 losers, with 1st July being the beginning of the buying campaign. 

My China shares are also looking OK.

Crowd behaviour and its impact on our thinking

Treacy analyses the impact of crowd behaviour on our thinking in some detail. The key point is that as a market trajectory intensifies: i.e. the herd's move develops into a gallop there is a strong temptation to dispense with rational thought and to get swept along by the mood of those around us. 

Notions like "earnings don't matter" gain currency so that stocks with dismal fundamentals become part of
the cohort of strong "buys." Market commentators have to shout louder to be heard. Only the most outrageous forecasts, in the direction of the trend, attract attention so that we are subject to more and more extreme predictions about how far this bull market will run. 

Conversely equally shocking forecasts of Armageddon and the disintegration of the financial world as we know it become the norm as a market succumbs to the impact of a credit crisis or any other story that can begin a downward price spiral. And it captures the mind of fearful investors.

Bottom line we, as investors, are sucked into a prevailing fashion and no rational consideration can sway our thinking as we are swept along by the rush of the herd. Only the smartest, and the richest are fully able to take the risk of anticipating the bottom of the market.  Only they can afford  to take advantage of the bargains that are available as an irrational market slashed the prices of good and bad stacks alike. It is easier to take profits and stand to one side as the herd runs towards the cliff in the bull market. But even this has its dangers. Fund managers who pulled out of the dot com bubble early were pilloried for missing the last days of profit opportunity.

Wednesday 6 August 2014

Chart reading, rhythms, crowd behaviour and the shape of charts. Where are we now?

I am sitting and worrying. My Chinese shares are doing OK with the exception of three, all in the same sector - internet real estate marketing (SFUN, EJ and LEJU). These are going to be ditched at the open of today's market.

Since the others are holding up in the face of a strong head wind I am going to keep them pro tem. (BIDU, BITA, NTES, NOAH, FENG, YY, VNET, VIPS, XRS, WBAI).

To hedge my position I am holding a small chunk of VXX which moves in the opposite direction from the market. A bit like a contra ETF but this one is based on the VIX which measures the "fear factor" in the S&P. I have an order to buy more at the open of the US market. So there's my strategy for the US market.

In the UK I have bought and am holding a batch of shares picked by my oldest and best share picking system. I started buying on 1st July and overall they are up 2%, pretty good in a market that is down 3% in the same period. (EXI, WIN, BRIT, CAML, GEMD, RNWH, OMI, PUR)

So the big question is where are we?

Chart reading 


Eoin Treacy quotes Dietrich Bonhoffer at the beginning of Crowd Money:

"If you board the wrong train, its no use running along the corridor in the other direction"

So which way is this train going?

Crowd Money puts forward the case for "Chart Reading" as a discipline quite separate from "Technical
Analysis." The difference, Treacy says, is that chart reading is the examination of charts to try to determine what they imply about "the actions, objectives and motivations of market participants." Chart movements show us the balance between supply and demand which in turn tells us whether buyers or sellers are in the ascendant.

Technical analysis, he defines as a technique which looks at the relation price to itself. It attempts to identify patterns and the opportunities that those patterns identify.

What Treacy is trying to identify are the rhythms of the market. There are two clear rhythms. These are trends when either demand or supply are in the ascendant. In these cases the market trends up or down depending in whether there is a preponderance of buyers or sellers. When there is a balance between buyers and sellers the market ranges until a new trend emerges.

The rhythms of crowd behaviour and the shape of charts


Four factors drive these rhythms for they create demand or supply. They are;


  • the story: a shift in the fundamentals of a market is identified and broadcast to participants: a new technology, a shortage of supply due to inadequate investment, a surplus caused by a reduction in demand by a major buyer. The propagation of information of this sort can fuel a bull or bear market as participants are convinced of the veracity of the story and the belief that it will influence the price of an asset which they own or wish to buy
  • liquidity: the easy and cheap availability of cash for buyers to participate in a market that is running is an important factor that fuels a bull market. The sudden withdrawal of that pool of money, or a hike in interest rates will rapidly put a brake on the move and throw it into reverse
  • governance: a good legal framework. One that encourages participation in a market and allows good investment decisions to be made easily so productivity is enhanced, can make the difference between a market that grows and one which stagnates
  • price action gives credence, or otherwise to our beliefs about what is happening in the market. If the price moves relentlessly in the opposite direction to the one predicted by our theory about the market, then we can be sure our theory is wrong. Price is the ultimate reality check.
With these four determinants in mind we can watch the market as we watch a herd of animals running across an African Savannah. The herd runs smoothly in one direction until the motivation for that move is exhausted and the group, all of its individuals moving independently swings and adopts a different direction.

The story has changed, or liquidity has dried up, or the regulation regime has been modified. But most of all we see the shift in direction.

Because the crowd is made up of individuals they do not always move as one and that is what makes reading the market difficult. A part of the herd may break away and attempt to pull in a different direction. Is that the beginning of a shift? Or will they be dragged back into the heart of the herd?

That is exactly where we are now. A breakaway is happening. The story of the market has not changed. If anything it is more favourable with economic conditions improving in some places. But there is a serious threat to liquidity. QE is coming to an end. Nevertheless we are not there yet. Interest rate rises are threatened but guidance suggests that the moment will be later rather than sooner.

So what we are seeing is a significant element in the herd of market participants taking fright. Will the herd turn to follow them and stampede in their direction? Or will the nervous ones be overwhelmed by the larger part of the herd? Will th majority see that plenty of money still flows into the hands of potential buyers? And will those buyers take advantage of the lower prices that the breakaway elements have generated?

We watch the price and we shall see.


Thursday 31 July 2014

Is this the big one? and Roundaphobia

Last few days I have been biting my nails. I'm almost up to my wrists.It wouldn't be so bad if I had not been tempted in - yet again. I know, I know. I keep saying it and I still I go for it.

This time it has not been so bad and I'll tell you why.

Lets start with some market graphs.Here's the DOW. This is the nasty one. The S&P is no better but the NASDAQ does not look nearly so ugly. (Don't worry about the blue/green line I am playing with the 60 day moving average.) Focus on the fact that three days ago the market broke a support line that has been there since January. Bad enough in itself and even worse when you see that the next level of support is around 16300 almost 450 points below where we are now and 850 points from the high.


There are various explanations - fear of the end of QE and higher interest rates stand out. A big surge in US$ value underlines this view. Flight to safety and all that.

Roundaphobia


Then there's the possibility that the market struggled when it hit 17000 - a big round number often creates a
market barrier for psychological reasons. This is another theme from Crowd Money. Treacy calls it Roundophobia. 12000 and 14000 were major barriers for the DOW on the way up. 12000 precipitated a 36% fall and once it hit 14000 the market tumbled over 50%. Spooky!

FTSE


The FTSE is struggling too. But it has not been pushing ahead as strongly as the DOW so today's movement is well within the bounds of a normal retracement.


China 


What I did was look at this graph and wondered whether I was onto a good thing because of the spectacular breakout.


The shares I bought were Chinese ones with strong fundamentals, quoted on the US market. They have been hurt, I was a late to the party, but they are still doing better than US shares. Question is will they be dragged down by a general pull back or is China on a different trajectory. It does not seem to have been linked to the US for some time. Let's hope that the decoupling still holds.

More nail biting in the next few days. I have bought VXX as a hedge. Time will tell and I can always run for cover.


Monday 28 July 2014

How trends end - part 3

There is little to say about type 3 endings as describe in Eoin Treacy's Crowd Money. They are a compound of the other two types.

In the example below, copper at the end of 2012, the ending begins with the sort of acceleration associated with type 1 but when the market pulls back, instead of falling all the way it finds support. There must be a level where it runs into latent demand. Demand begets demand for the strong upward reaction brings back
traders who were stopped out and now are reluctant to miss the upward action. The market then begins to range between the previous highs where it meets a vacuum of demand and previous lows where buyers are waiting to jump aboard again. The long players find it hard if not impossible to make money because the market does not pull up strongly enough after they find entry points. Short traders, on the other hand, are finding it easier to profit on the downside. Eventually is is all over as the market fails to make an upside break and with no new buyers and holders selling out before they have lost too much the bears win the battle
.

Not all endings play out the same way but with the tree types to look out for it should be a bit like an elephant: hard to describe but also hard to miss. We are basically looking for three markers

  • sudden acceleration
  • loss of momentum
  • abnormally large pull backs
I'm watching out for these.