Wednesday 29 May 2013

So where are we now?

I'm not the only one to struggle in calling the market's next move. All the commentaries I have seen have little to say. Few say, as I do, I don't know. 

I have been persuaded to put a trend line on the graph, with 2 standard deviation confidence lines. I'm not sure they are particularly helpful so I have made them rather faint. What they show on the FTSE chart is that the last high of 5 days ago touched the higher confidence line and this was followed by a pull back to the trend line. There the market sits. It could go as low as 6500 without breaking the up trend. If you were to look at the DOW or the S&P you get very much the same picture.


The Nikkei has already penetrated the bottom of its channel and is looking rather sickly to my mind.


A few days ago I drew attention to the rise in the interest rate on 10 year US Treasury bonds. That rise continues. It is now touching the top of its trend channel. 


You will recall that low interest rates have been one of the drivers of the stock market’s relentless rise. But the chart shows that they have risen by 32% in the past three and a half weeks. Before the rise, the yield on the DJI shares was 1.7 times that on those 10 year bonds but it has now fallen to 1.3 times. The chart reminds us that bonds have yielded far more the past. The low interest rate motor for higher stock prices could be running out of steam. On the other hand since the interest rate is reaching the top of its trend channel , at least in the short term, there may be some respite.

What I am doing


I’m still holding the better performing shares from the portfolio I built up earlier this month. For those who are interested they are LGF, KR, SMI, PPC, BONT, NRG, CIG, AOL, NVTL, SIRI, FHCO, all on the American market. (Details available on Yahoo Finance )They represent about 30% of my portfolio with the rest being in cash and GVC, my stalwart UK share which is not doing much at present. A couple of these shares are probably for the chop later today.

Backtesting.


You will recall that I have been backtesting market timing methods and that I created a Support and Resistance system for timing entry to and exit from the market. One of the reasons that I am holding on to my remaining shares at this inscrutable time is that the system's sell trigger has not been activated.

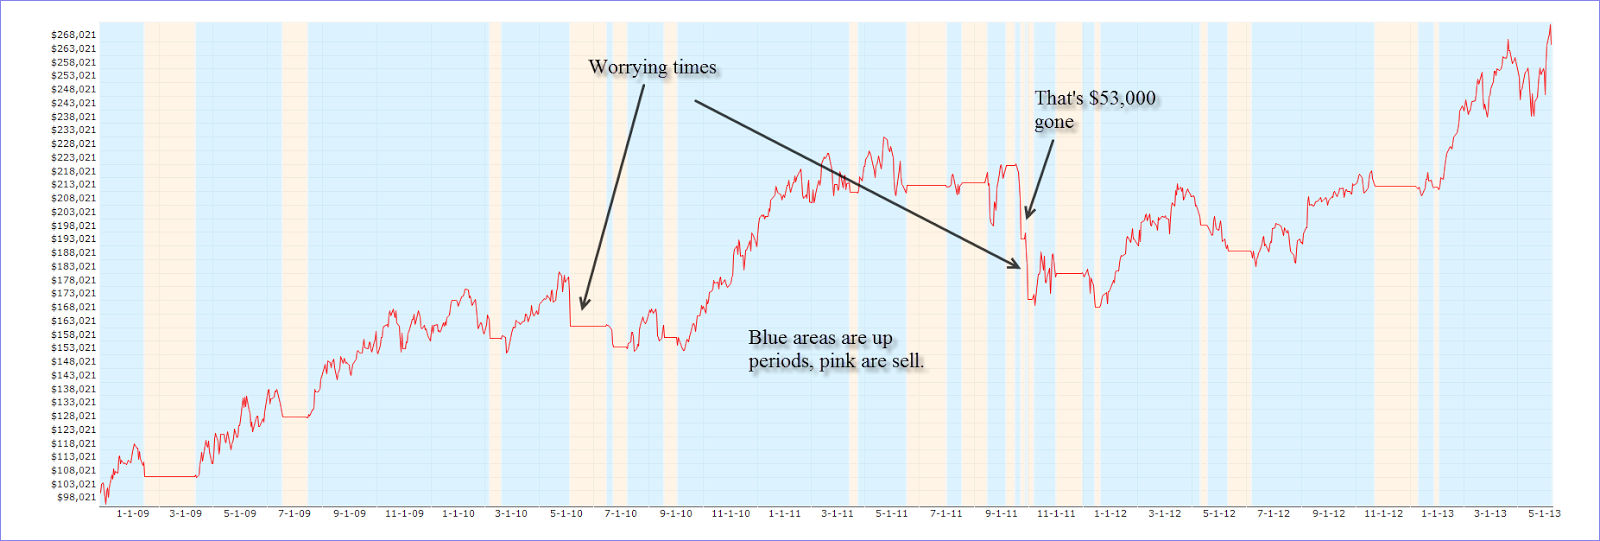
The system's backtest yielded great results but suffered an unacceptable maximum pullback in when the market whipped back and forth in 2011. I have been trying to refine the system to reduce the amount of profit the system sucked back as it generated too many signals.

So far I have failed to find a method to reduce the pullback significantly. But the stop losses that I added to the system have increased the annual return from 36 to 45%.


The chart shows the pattern of returns generated by the modified system over the period November 2008 and May 2013.


Saturday 25 May 2013

Best laid plans


I lost my nerve. It was that fall on the Japanese market that really got to me. A 7% drop in one day. It just shows you what can happen when an overheated market hits the buffers. I was there when the tech market bubble burst and I will never forget what true panic felt like. I had pulled out before the real trouble started but I saw friends desperate as they struggled to get hold of their brokers. That candle big red candle reminded me of those frantic times


There was follow through in the rise in interest rates on US Treasury bond that I mentioned in the last posting too.


The Wall Street, spooked by Bernanke’s comments that QE was to be “tapered”, did not react nearly so badly but it was enough to frighten me. Everyone knows the adage “Don’t play with more than you can afford to lose.” Well I do that all the time. All the money I have left in the world, apart from my investment in my home, is exposed to the stock market. So when I find myself staring into a pit I have to act. I have a big appetite for risk but only when the odds are in my favour. And that’s why I had to abandon my beautifully laid plans to wait for a fall of x% after the break of support before I exited the market. I could not afford the loss it would entail.


One reader described how he allowed tightened trailing stops to take individual shares out of the market leaving him with very decent profits. Well done! I followed a similar path selling off my weaker shares and the ones which were losing money fastest on the day following that big market drop. My pain was in the loss of paper profits. I pulled out over two days reducing my investment from 75% to 33%. This was a more measured exit from the market than the one in mid-April. And that is partly because I now know that a break of support +x% is a good signal for exit, and that point had not been reached.

A friend asked me why I used the DJI as my signal rather than the S&P. There is no good answer to that question. I just happened to choose the DOW. It is the index that everyone talks about. What is important is that it worked when backtested. It is a signal just like any one of those favoured by technical traders. It’s like “buy or sell when there is a moving average crossover” or “when the MACD reaches a certain point do this” or “when price action creates a flag chart pattern consider this action.” What my S&R signal says is that when support or resistance on the DJI is broken plus a certain percentage, that is a sell or a buy signal. It has the virtue, compared with the technical analysis signals, that backtests show that over a long period of time S&R works exceptionally well. You will make money.

So here I sit, partially invested and with a decent pile of cash, waiting to see what the market will do next
. We are in uncharted territory. Without a map we just have to feel our way forward. It is only Elliott wave aficionados who dare to predict where the market will turn. I am not a believer in their approach which seems to me to spend much of its effort on self-justification as the market sails past their predicted turning points.

I have plenty to do. I need to extend my backtests of S&R and I need to refine the system so it is not so vulnerable to periods of loss through drawdown. That should keep me busy. 

At last the sun is shining and there is blossom on the apple tree outside my window. Long may it last.


Thursday 23 May 2013

Ouch! That hurt


For some time I have been warning that the end of QE could mark the end of the current stock market rally. 

No new money for banks to lend to speculators would bring an end to buying pressure. Also the actual mechanism which the Government uses to print money will begin the process of pushing up interest rates on bonds.

How’s that? The Government buys its own bonds from financial institutions and pays for them with freshly printed money, money from nowhere. The effect on the bond price of this massive buyer of Government securities is to drive up the price. A high bond price means a low interest rate. (A bond costs $100 and yields 2%. If the price now rises to $125 the yield falls to 1.6% [$2 return on £125 equals 1.6%]. Conversely if the bond price falls to $75 the yield rises to 2.67%). That is why we have had those low bond yields for so long. The Government has been driving the yields down by its bond buying activities.

As I explained yesterday, low bond interest mean that that the dividend yields on shares look very attractive and create a demand for shares so the stock market rages on upward.

And then when, as yesterday, the Government announces it is all going to end it begins to look ugly. Bernanke and the minutes of the Federal Reserve Committee both indicated that “tapering of the monetary stimulus” (a new bit of vocabulary to describe the end of the road for free money) was being considered as early as June.

The chart I showed yesterday which indicated that sharp rise in bond yields was all too prescient. The market knows, you know. Before any of the rest of us.

I should have heeded that warning. Instead I went on buying shares and through the morning and afternoon it looked as I was doing the smart thing. Then Bernanke spoke and it all fell apart. So here I am 75% invested and the rug gets pulled out from under me. 


There will be those saying we knew it all along. But they are mostly the stopped clock merchants who have been warning of disaster all through this stock market bull run.

In one way they are right. The economy says no. The euphoric rise is misplaced. But the markets are driven by the cash available to invest and the relative attraction of the returns different markets offer. When the Government messes with them we face the chickens coming home to roost.

A moment more to think about those chickens. The US Government has been borrowing money like there was no tomorrow – literally since there was no way they could ever pay it back.  So out there, there are bonds worth trillions of Dollars. Wouldn't it be great if those bonds suddenly fell in value. Higher interest rates will push down their resale values. But the holders have the option of waiting till they are due for redemption and get paid full value. Unless!  Inflation reduces the cost of redeeming those bonds in real terms. (Remember those days when we could borrow money to buy houses easily and inflation meant that it cost us a lot less to pay back our loans. We were left with a huge profit on the value of our home. Same thing will happen here.) So my prediction is that not far down the line Governments will allow inflation to rip in order to burn off the cost of redeeming all that debt.

That leaves me with an immediate dilemma. Having been sucked into the market what do I do? My carefully laid plan to sell when support is broken by x% would cost me a lot of cash which I cannot afford. Do I stick with that idea, or do I cut my losses in the face of what looks like a steam roller coming my way?

On the chart it does not look quite as bad as my losses in cash do. I guess I have till this afternoon to contemplate what to do. 


Unless I start with a little dabble in the gold market.


Wednesday 22 May 2013

How high can it go?

The market rise continues. There is no sign if weakness in this Charles Atlas of a market. But, like all good things, it must eventually come to an end. So far there is very little sign of that. In 4 of the past 10 days the DOW has pulled back towards the end of the day suggesting that some investors are taking advantage of high prices to take profits. But there has been no upsurge in volume. Today's chart is the S&P which outshines the DOW.


This does not take away worries about what will happen next. But I am still buying and am currently 55% invested. My latest batch of purchases was on Monday when I bought GFIG, NVTL, SIRI, HILL and NAVR.

Since I started splurging my cash on 3rd May I've had 10 winners and 10 losers. That includes Monday's batch of cookies which have only just gone into the oven. If I exclude those the score is 9 to 6. I am worrying about TCX, RJET and WG which are getting close to  a 10% loss, including costs. But I am feeling smug about CIG, LGF,SAFM, SMI and HILL all of which are doing well. You can look them up on Yahoo to check out their charts. (I have provided helpful links so you just have to click to see what is happening. See how well I look after you all.)

There must be at least one cloud on the horizon. (You see how nervous I am having exposed myself to the
market). And it is provided by Colin Twiggs of Incredible Charts. He points out that the 10 year US Treasury Bond yield has broken resistance and could, I repeat could, be coming to the end of a bear trend that has lasted for 30 odd years. You will recall that very low interest rates is one of the drivers of the sock market's strength.

What may be happening is that bond investors, frustrated by low returns are pulling out and pushing down those very high bond prices. (The reciprocal of declining bond prices is higher yields). As these newly released funds are invested in the stock market they will contribute to a continuing upward trend. They may even cause an acceleration. The inevitable consequence will be lower yields on he stock market and cheaper higher yielding bonds. And then the stock market train could run into the buffers.


Sunday 19 May 2013

Another quickie

Another very quick update. Latest purchases need a little more time to get going but the first batch are doing nicely. Not unexpected given how well the market has been doing.

However you will remember that I pulled out of the market when it pulled back on the 17th of April. If I had been working on my support and resistance (S&R) system I would have stayed in and taken the losses on the chin. If the market had continued to fall I would have been stopped out with a slightly bigger loss. But the opportunity cost of exiting the market is way bigger. I even began to short the market so making my loss even greater. I now have to steel myself to reentering the market at higher and higher prices which, inevitably incurs greater risk.

All this goes to show that doing your research properly pays dividends. If only I'd known in mid April what I know now I would be richer and happier. S&R is the way to go. I still have to fine tune: take my backtesting further to convince myself that it will work in a wider range of circumstances. And I have to work on cleaning up those periods when the drawdown becomes  unacceptable. (See the last few posts for a report on the research into S&R so far.)

The market continues its trajectory into the uncharted territory. It's now over 1000 points above its previous all time high. No guesses about how high it will go. But now I know what to do when it begins to fall.


Wednesday 15 May 2013

Acting on information

This is a mini post. No charts, no market review. Just a heads up on what I have decided to do as a result of
my review of support and resistance as described in the last posting. More work needs to be done but the
initial results are so good that I thought I should act.

There's no point in putting in the work if you do not act on it. I am working on the principle that in this up-
phase of the market I should be fairly well invested. The risk is I might be a bit late but, as they say nothing ventured nothing gained. So I have bought: XL, SAFM (adding to existing holdings) NFLX, AOL, SUSS, WG, CIG, NRG. All these in the US. Also I have bought VMED in the UK since the adr appeared in my US search.

I'll just have to wait and see how these go.The last batch I bought is working out well. As ever this is not a recommendation just a record of what I am doing..

Friday 10 May 2013

Good news!


In fact it's fantastic news. I am very excited. Very, very excited.

Some years ago, I bought, at huge expense, from Vector Vest, the most fabulous tool. It's worth every penny. It's called the "simulator". So far I have used it to choose the best share picking methods out of the almost 300 that Vector Vest provides. It has guided me well. Unfortunately it only works for US stocks. However I have now used it to test timing strategies and in this area the US is usually a good guide to what is happening.

I spent yesterday tediously putting the simulator through its paces to discover whether my support and resistance (S&R) timing system works (see the previous post), and wow! Does it work.

The simulator allows you to test timing lists against each other. Each timing list consists of a series of dates which are assigned the value up, down or neutral on that day. You can then set up a simulation which instructs the program to buy or sell shares based on one of the search method provided by the program. The simulation starts with a $100,000 virtual portfolio.

There are several pre-loaded lists based on VV’s timing systems, e.g. “confirmed calls”, “primary wave”, “green light buy/relative timing kicker.”. To this I added a list based on my S&R  plus or minus x%. The chart below shows an example of how this works from 2010 when the market was choppy and buys and sells were close together.


I told the simulator to buy shares, based on my favorite search method , whenever the signal was up and to sell them and go into cash when it was down. The search tool I used was one I had picked out as being strong and consistent through a series of simulator tests over a period of years. The simulator would then wait for the next up signal and would then run the search again and buy shares from the new recommended batch.

The results I achieved were very heartening and, subject to further tests, suggests I might well have found that holy grail of which I wrote in the previous post.

I tested from 24 November 2008 to the present (4 years and five months of rising but choppy trading). The Dow rose 79% over the period. The returns achieved by my simulations were as follows:

gain for period
annualised gain
S&R
164%
37%pa
Primary wave
-14%
-3%pa
Confirmed calls
77%
17%pa

Cracking result for my S&R you have to admit. I tested primary wave specifically because one of you kind readers suggested it might be better for my style of trading than confirmed calls. You may be right but the system seems to be hopeless for this type of long term trading. Thanks anyway. Please keep those comments coming. I need all the help I can get.

Here is a chart of how the simulation worked out for the S & R system. You can see that there were lots of worrying pull backs in profits, i.e. lots of times when in the real world, as an investor you would be sweating and kicking yourself, wishing you had pulled out before. The worst was a $53,000 pull back or 27% drawdown, as Vector Vest would put it. But the nerves of steel are a prerequisite for this game. 


A final caveat. Drawing and interpreting support and resistance lines is subjective, an art.  Vector Vest’s systems are mechanical. So all their errors can be blamed on the machine.

Lots more work is needed to check the results and to refine the system. But so far it looks very good indeed.

Next week may be an even thinner week for posts than this one. Lots of family stuff coming up. But I will endeavor to comment on anything dramatic. Here is last night’s chart. Talk to you soon guys.


Tuesday 7 May 2013

The Holy Grail


I am not a happy bunny. I had written more than half this post online in Blogger and then without warning it vanished. I detest going over old ground. I hope that my bad mood does not intrude on my rewriting.

How do you predict changes in market direction?


I am deeply disappointed. You know that I am a big fan of Vector Vest. Their tools for stock picking are second to none. They are too good and they hide the weaknesses that I have found in their timing systems. If you buy the right shares and your timing is right you can make shedloads of money and can afford to get your timing wrong some of the time.

Almost as soon as I bought the Vector Vest  system I tested the “confirmed up and confirmed down” signals and found that if I had used them to time my entry and exit from the market I would have lost money. I have now tested their latest timing systems and found they too are wanting.

The unisearch tools and the backtesting facilities offered by the program more than make up for the timing failings and I am sure that, as in the past, I will go on making lots of money using those wonderful tools. But market timing is also important. And I will have to look elsewhere to find how best to pick my moments for piling in and pulling out of the market.

At present there are two road that I plan to follow in my quest for the holy grail: a system that will guide me to choosing the best times to buy and sell:
  • ·         volume spikes
  • ·         support and resistance lines

Both look promising except that I am at a loss about how to develop a method to backtesting their performance and to be sure that they are the goods.

Volume spikes


In the case of volume spikes I can show that they indicate a change of direction more often than not. But I cannot show whether that will be a pause on a reversal of direction and I cannot say how big the move they predict will be. Nor I cannot show how quickly it will happen.

To demonstrate I use and old chart from January last year which shows a series of volume spikes each of which signaled a change in direction. It ended with a spike which had just occurred. What happened next was that the rising market flattened for a number of days, then resumed its upward course. It paused again, then there was another larger volume spike and then finally the market fell. Tricky to know exactly how to play the signal.


Support and resistance


With support and resistance I can show you today’s gold chart which provides a beautiful example of how well support and resistance lines work. If we sold out at the end of the day on the 12th April when the market broke support we would have saved ourselves the 7% fall that occurred the next day. If we had gone back into the market to make money from the recovery selling on the 26th April we could have made a nice little 8% in 8 days. It would have avoided the downturn which was accurately predicted when the market hit the old support line which had  become a resistance line.


The problem Is the subjectivity in drawing these lines. Again I don’t see clearly how I could backtest the system. But I feel convinced that the holy grail lies nearby. I shall continue my search.

The market today


As for the market today, it continues its upward climb having broken through short term resistance. Every day sees a new all-time high in the US market. 


Chicken Montalbano (A kind of Sicilian sweet and sour chicken)


This is another recipe I picked up from a Montalbano book. I did a fair bit of adaptation because the original calls for rabbit and my wife is not keen. Also rabbit is not that easy to come by round here unless you go out and shoot it yourself. I’ve never in my life handled a gun so that’s not going to happen. What I did instead was substituted chicken breast. I picked out what looked best from a number of recipes I found trawling the internet, both in English and Italian. (it’s amazing how good those internet translating machines are these days).

I took two plump chicken breasts sliced them lengthwise and marinaded them in 125 ml red wine vinegar for 4 hours along with 2 bay leaves

I then prepared the rest of the ingredients. One sliced onion, three chopped sticks of celery, two chopped carrots, 35 gms of capers, 35 gms of sultanas, 35 gms of pine nuts, 150 gms of green pitted olives, and 2 tbs of honey.

I heated the oven to 180 degrees.

I drained the vinegar from the chicken into a jug and kept it with its bay leaves.

I coated the chicken slices liberally in flour and fried them gently in olive oil for some ten minutes. I put them in an ovenproof dish. I added more oil and fried the onion, celery and carrots gently for ten minutes adding a bit more flour towards the end. In the mean time I dissolved the honey in the vinegar marinade. I tipped the onion mix over the chicken and poured over the vinegar and honey and added 750 ml of chicken stock. I stirred in the sultanas and pine nuts.

The whole lot went into the oven for just over one hour. About ten minutes before the end of cooking I stirred in the olives and capers.

I served the casserole with new potatoes and beans.

Judging by her enthusiasm my wife gave it 5 stars.


Friday 3 May 2013

Buy in May

Will I regret this? I might. This may be a bull trap.

Vector Vest has signaled a buy based on a) standard buy criteria of consistent price rises over a day, and a week; the ratio of stocks represented as buys and sells; by the rise in their proprietary indicator, the RT, which measures the dynamics of a stock's price movements over one day, one week, one quarter and one year; and b) the crossover of the RT's 10 and 15 day moving average.

All these measures look backwards so there is an inherent risk that they signal too late. But Vector Vest claim to have tested and retested, and they conclude that this combination of criteria indicate that the market is likely to continue to rise. I have staked a bit less than a quarter of my portfolio on the belief that they are right.

I have picked my shares based on selection criteria that, in the past, have selected shares that have risen sharply in price over the period of one month. So you see I don't expect to hold these shares for very long.

My mini portfolio, all US share, at present consists of: TCX, LGF, KR, RJET, SAFM, XL, SMI. If you want to know more about these shares two excellent free sources of information are Yahoo Finance and Market Watch. Just type in the symbol codes in the boxes provided and loads of information is at your finger tips.

Lets have a quick look at a chart. I've uses the S&P which has only recently broken through its all time high. If we look at the DOW we have to face the fact that it is very very close to the  15000 level which could prove a barrier. As things stand with Europe speaking of negative interest rates signs for further stock market growth seem good. My fingers are crossed.


Wednesday 1 May 2013

Sitting on my hands again

Last week was a fat week, this week will be a thin one. Not much happening, I've pulled out of the market. Hence very little to say.

It is interesting to see that the S&P, a broadly based index which follows 500 of the larger stocks on the US market, is outperforming the DJI, has spent the last six trading days outperforming the DOW and has now caught up at a point comfortably above its previous all time high. That high occurred in October 2007 just before the crash of 2008.

The chart shows, not that recent catch up, but the fact that the DJI has outperformed the S&P throughout the recovery period  which began in March 2009. This underlines the analysis made in the last post which showed that the driving force of the market rise was the differential between dividend returns and interest rates. Stock buyers were seeking good returns and security.


The performance of the FTSE demonstrates how hard it is to decide what to do for the best. The market is showing some strength but not enough to stiffen the backbone of one who has already lost in this tricky market.

We may have a little clue in the volume spike which occurred a couple of days ago. I have marked how previous volume spikes have signaled a change in direction. It is hard to know whether the recent spike will mark a change and if it does which direction the market will choose. I would feel more confident about its significance if there were spikes in the US. We have to wait and see.


Proof


We are lucky to have Bath’s Theatre Royal so close by. Easy to park and an excellent selection of plays to choose from.

Proof byDavid Auburn is the latest offering. The play won a Pulitzer prize in 2000. This production by Polly Findlay began life at the Menier Chocolate Factory. Reviews were tepid but I strongly disagree. I thought all aspects of the production sparkled.

The play covers the same ground as A Beautiful Mind: the relationship between creativity and mental illness, specifically in the brains of mathematicians. But it concentrates on the daughter of the mathematical genius, who may or may not be afflicted with the same malady as her father.

There are just four characters: Robert, the dead or dying genius, past the peak of his creative powers; Catherine, his younger daughter, who has devoted her self to caring for him; Hal, Robert’s acolyte, who is
searching through his later papers in an effort to find nuggets of genius among the mad ramblings; and Claire, the elder daughter, who has distanced herself from her family but provides financial underpinning.
There are two star performers: Mariah Gale as Catherine conveys the pain of coping with a mad father beautifully, and Jamie Parker as Hal effortlessly portrays an intelligent but rather gauche young man, struggling to stay afloat in a sea of turbulent emotions.

There are no villains in this quartet of characters. They are so different from each other: Robert wishing he could rekindle his former genius but trapped in his own mad world; Claire wanting the best for her father and sister, but willing to give them the space to choose not to do what she thinks is best; Catherine devoting her life to her father while nursing a genius of her own; and Hal, an honest and honourable outsider who in his own awkward way is a catalyst who offers solutions to the family’s problems.

The four actors play off each other like table tennis champions returning the trickiest of serves. 

Emma Cunniffe and Matthew Marsh as Claire and Robert also produce strong performances and the Chicago accents of the whole cast never falter.

The play, the production, and above all the performances provided a spectacular evening’s entertainment.